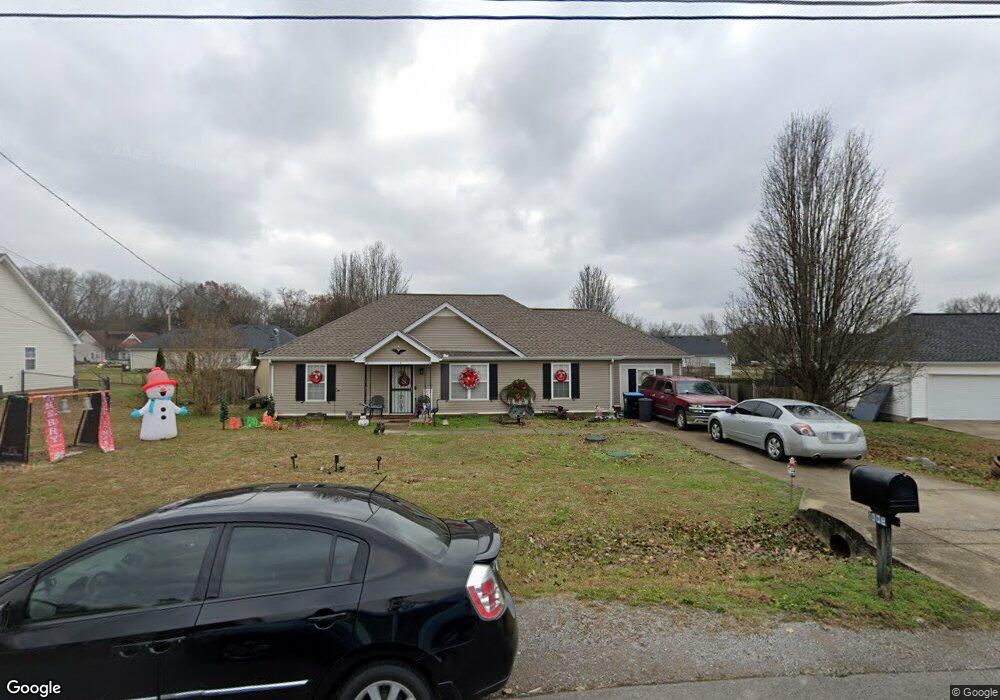
1008 E Mccoury Ln Murfreesboro, TN 37130
Estimated Value: $317,665 - $402,000
Studio
2
Baths
1,574
Sq Ft
$229/Sq Ft
Est. Value
About This Home
This home is located at 1008 E Mccoury Ln, Murfreesboro, TN 37130 and is currently estimated at $361,166, approximately $229 per square foot. 1008 E Mccoury Ln is a home located in Rutherford County with nearby schools including Walter Hill Elementary School, Oakland Middle School, and Oakland High School.
Ownership History
Date
Name
Owned For
Owner Type
Purchase Details
Closed on
Jun 14, 2019
Sold by
Shumate Cynthia D
Bought by
Shumate Michael E and Shumate Cynthia D
Current Estimated Value
Purchase Details
Closed on
Jun 5, 2009
Sold by
Shumate Michael E
Bought by
Shumate Cynthia D
Purchase Details
Closed on
Mar 11, 2004
Sold by
Propert Spurlock and Propert Kestner
Bought by
Shumate and Cynthia
Home Financials for this Owner
Home Financials are based on the most recent Mortgage that was taken out on this home.
Original Mortgage
$102,600
Interest Rate
5.62%
Mortgage Type
Purchase Money Mortgage
Create a Home Valuation Report for This Property
The Home Valuation Report is an in-depth analysis detailing your home's value as well as a comparison with similar homes in the area
Home Values in the Area
Average Home Value in this Area
Purchase History
| Date | Buyer | Sale Price | Title Company |
|---|---|---|---|
| Shumate Michael E | -- | None Available | |
| Shumate Cynthia D | -- | -- | |
| Shumate | $108,000 | -- |
Source: Public Records
Mortgage History
| Date | Status | Borrower | Loan Amount |
|---|---|---|---|
| Previous Owner | Shumate | $102,600 |
Source: Public Records
Tax History
| Year | Tax Paid | Tax Assessment Tax Assessment Total Assessment is a certain percentage of the fair market value that is determined by local assessors to be the total taxable value of land and additions on the property. | Land | Improvement |
|---|---|---|---|---|
| 2025 | $1,207 | $64,350 | $13,750 | $50,600 |
| 2024 | $1,207 | $64,350 | $13,750 | $50,600 |
| 2023 | $1,207 | $64,350 | $13,750 | $50,600 |
| 2022 | $1,023 | $63,325 | $13,750 | $49,575 |
| 2021 | $960 | $43,275 | $9,375 | $33,900 |
| 2020 | $960 | $43,275 | $9,375 | $33,900 |
| 2019 | $960 | $43,275 | $9,375 | $33,900 |
| 2018 | $909 | $43,275 | $0 | $0 |
| 2017 | $892 | $33,275 | $0 | $0 |
| 2016 | $892 | $33,275 | $0 | $0 |
| 2015 | $892 | $33,275 | $0 | $0 |
| 2014 | $827 | $33,275 | $0 | $0 |
| 2013 | -- | $33,500 | $0 | $0 |
Source: Public Records
Map
Nearby Homes
- 206 Canvasback Ct
- 7212 Riverwalk Blvd
- 7411 Antietam Ln
- 111 Ridgepark Ct
- 107 Antler Dr
- 2045 Barretts Ridge Dr
- 4197 Betty Ford Rd
- 132 Trailside Dr
- 61 Nancy Reagan Dr
- 56 Nancy Reagan Dr
- 1509 Martha Washington Way
- 69 Nancy Reagan Dr
- 3194 Barretts Ridge Dr
- 1900 Martha Washington Way
- 1713 Martha Washington Way
- 4604 Marie Curie Ct
- 4609 Pat Nixon Ct
- 0 Pat Nixon Ct
- 4510 Pat Nixon Ct
- 4606 Pat Nixon Ct
- 1012 E Mccoury Ln
- 1004 E Mccoury Ln
- 121 Greenwing Ct
- 125 Greenwing Ct
- 1016 E Mccoury Ln
- 1009 E Mccoury Ln
- 1000 E Mccoury Ln
- 6904 Riverwalk Blvd
- 109 Greenwing Ct
- 1013 E Mccoury Ln
- 6908 Riverwalk Blvd
- 129 Greenwing Ct
- 1022 E Mccoury Ln
- 1017 E Mccoury Ln
- 103 Greenwing Ct
- 116 Greenwing Ct
- 6912 Riverwalk Blvd
- 124 Greenwing Ct
- 1021 E Mccoury Ln
Your Personal Tour Guide
Ask me questions while you tour the home.