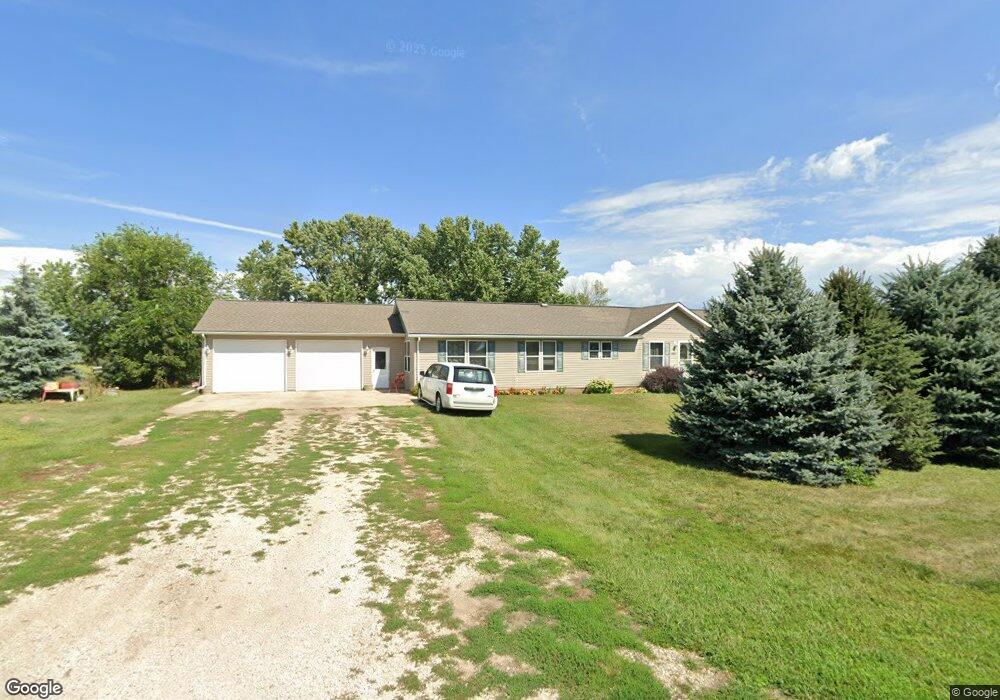
1008 E Pine St Marcus, IA 51035
Estimated Value: $207,000 - $285,234
3
Beds
4
Baths
1,904
Sq Ft
$130/Sq Ft
Est. Value
About This Home
This home is located at 1008 E Pine St, Marcus, IA 51035 and is currently estimated at $247,059, approximately $129 per square foot. 1008 E Pine St is a home located in Cherokee County with nearby schools including MMCRU Marcus Elementary School and MMCRU High School.
Ownership History
Date
Name
Owned For
Owner Type
Purchase Details
Closed on
Jan 14, 2025
Sold by
Bentz Lonnie
Bought by
Sweda Anthony J and Sweda Kimberly C
Current Estimated Value
Purchase Details
Closed on
May 31, 2007
Sold by
Klein Alan and Klein Lorelei
Bought by
Bentz John A
Home Financials for this Owner
Home Financials are based on the most recent Mortgage that was taken out on this home.
Original Mortgage
$187,000
Interest Rate
6.2%
Mortgage Type
Construction
Create a Home Valuation Report for This Property
The Home Valuation Report is an in-depth analysis detailing your home's value as well as a comparison with similar homes in the area
Purchase History
| Date | Buyer | Sale Price | Title Company |
|---|---|---|---|
| Sweda Anthony J | $235,000 | None Listed On Document | |
| Sweda Anthony J | $235,000 | None Listed On Document | |
| Bentz John A | -- | None Available |
Source: Public Records
Mortgage History
| Date | Status | Borrower | Loan Amount |
|---|---|---|---|
| Previous Owner | Bentz John A | $187,000 |
Source: Public Records
Tax History
| Year | Tax Paid | Tax Assessment Tax Assessment Total Assessment is a certain percentage of the fair market value that is determined by local assessors to be the total taxable value of land and additions on the property. | Land | Improvement |
|---|---|---|---|---|
| 2025 | $3,516 | $274,730 | $32,460 | $242,270 |
| 2024 | $3,516 | $259,870 | $32,460 | $227,410 |
| 2023 | $2,808 | $259,870 | $32,460 | $227,410 |
| 2022 | $2,842 | $180,790 | $32,460 | $148,330 |
| 2021 | $2,842 | $180,790 | $32,460 | $148,330 |
| 2020 | $2,764 | $180,790 | $32,460 | $148,330 |
| 2019 | $2,830 | $180,790 | $0 | $0 |
| 2018 | $2,908 | $185,979 | $0 | $0 |
| 2017 | $2,964 | $185,979 | $0 | $0 |
| 2016 | $3,050 | $185,979 | $0 | $0 |
| 2015 | $2,752 | $158,957 | $0 | $0 |
| 2014 | $2,754 | $158,957 | $0 | $0 |
Source: Public Records
Map
Nearby Homes
Your Personal Tour Guide
Ask me questions while you tour the home.