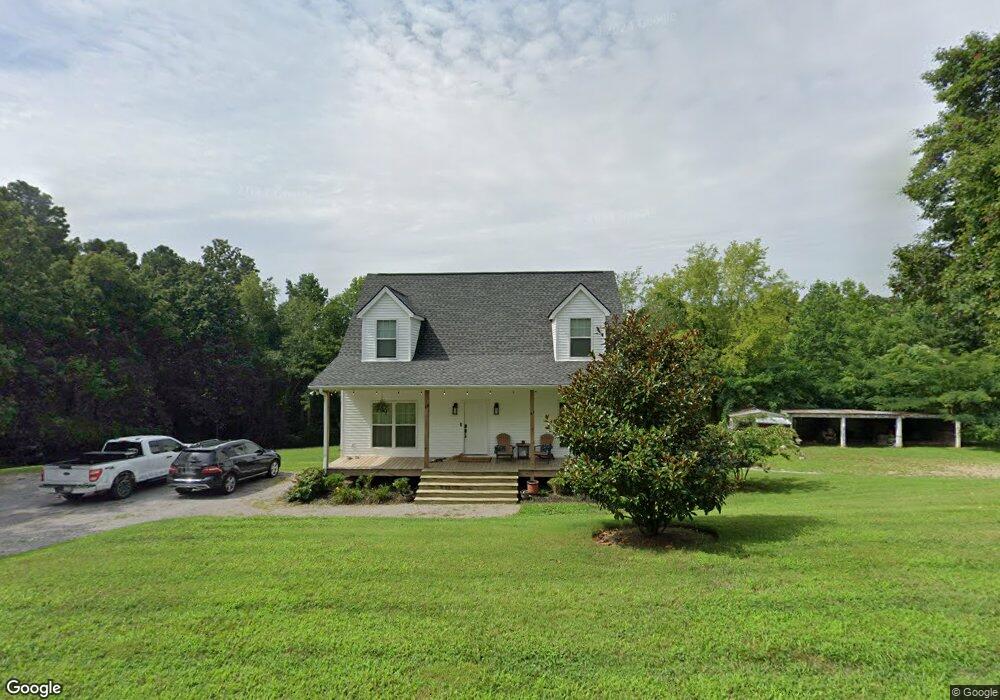
1008 E Sears Rd Pegram, TN 37143
Estimated Value: $530,000 - $652,000
3
Beds
3
Baths
1,758
Sq Ft
$334/Sq Ft
Est. Value
About This Home
This home is located at 1008 E Sears Rd, Pegram, TN 37143 and is currently estimated at $586,516, approximately $333 per square foot. 1008 E Sears Rd is a home located in Cheatham County with nearby schools including Pegram Elementary School, Harpeth Middle School, and Harpeth High School.
Ownership History
Date
Name
Owned For
Owner Type
Purchase Details
Closed on
Aug 17, 2018
Sold by
Smith Travis
Bought by
Hayes Jason M and Hayes Danielle F
Current Estimated Value
Home Financials for this Owner
Home Financials are based on the most recent Mortgage that was taken out on this home.
Original Mortgage
$285,240
Outstanding Balance
$246,685
Interest Rate
4.5%
Mortgage Type
FHA
Estimated Equity
$339,831
Purchase Details
Closed on
Nov 11, 2013
Sold by
Cheever Dennis Clay
Bought by
Smith Travis
Home Financials for this Owner
Home Financials are based on the most recent Mortgage that was taken out on this home.
Original Mortgage
$35,000
Interest Rate
4.26%
Mortgage Type
Commercial
Purchase Details
Closed on
Dec 11, 2007
Sold by
Heule Donna
Bought by
Cheever Dennis Clay
Purchase Details
Closed on
Oct 6, 1998
Bought by
American Gen Fin
Purchase Details
Closed on
Nov 13, 1989
Bought by
Cox Thomas Hartwell and Cox Juanita
Create a Home Valuation Report for This Property
The Home Valuation Report is an in-depth analysis detailing your home's value as well as a comparison with similar homes in the area
Home Values in the Area
Average Home Value in this Area
Purchase History
| Date | Buyer | Sale Price | Title Company |
|---|---|---|---|
| Hayes Jason M | $65,000 | None Available | |
| Smith Travis | $40,000 | -- | |
| Cheever Dennis Clay | $46,900 | -- | |
| American Gen Fin | $49,010 | -- | |
| Cox Thomas Hartwell | -- | -- |
Source: Public Records
Mortgage History
| Date | Status | Borrower | Loan Amount |
|---|---|---|---|
| Open | Hayes Jason M | $285,240 | |
| Previous Owner | Smith Travis | $35,000 |
Source: Public Records
Tax History
| Year | Tax Paid | Tax Assessment Tax Assessment Total Assessment is a certain percentage of the fair market value that is determined by local assessors to be the total taxable value of land and additions on the property. | Land | Improvement |
|---|---|---|---|---|
| 2025 | $2,342 | $121,475 | $33,250 | $88,225 |
| 2024 | $2,102 | $121,475 | $33,250 | $88,225 |
| 2023 | $1,977 | $69,425 | $8,100 | $61,325 |
| 2022 | $2,015 | $72,050 | $8,100 | $63,950 |
| 2021 | $2,015 | $72,050 | $8,100 | $63,950 |
| 2020 | $2,007 | $72,050 | $8,100 | $63,950 |
| 2019 | $1,565 | $72,050 | $8,100 | $63,950 |
| 2018 | $315 | $9,875 | $7,450 | $2,425 |
| 2017 | $295 | $9,875 | $7,450 | $2,425 |
| 2016 | $281 | $9,875 | $7,450 | $2,425 |
| 2015 | $298 | $9,875 | $7,450 | $2,425 |
| 2014 | $298 | $9,875 | $7,450 | $2,425 |
Source: Public Records
Map
Nearby Homes
- 1546 Old Charlotte Pike
- 4222 Gourley Rd
- 0 Savely Rd
- 1175 Nora Ln
- 5533 Old Sams Creek Rd
- 1111 Old Charlotte Pike
- 4017 Beverly Hills Dr
- 1097 Paiute Trail
- 1065 Sioux Trail
- 1517 Bending River Dr
- 1062 Riverspring Dr
- 8218 Old Pond Creek Rd
- 7020 Bridgeport Dr
- 15 Cedar Valley Ct
- 464 Thompson Rd
- 0 Cedar Valley Ct Unit RTC3118358
- 0 Cedar Valley Ct Unit RTC2938962
- 914 Watercourse Ct
- 957 Watercourse Ct
- 942 Watercourse Ct
Your Personal Tour Guide
Ask me questions while you tour the home.