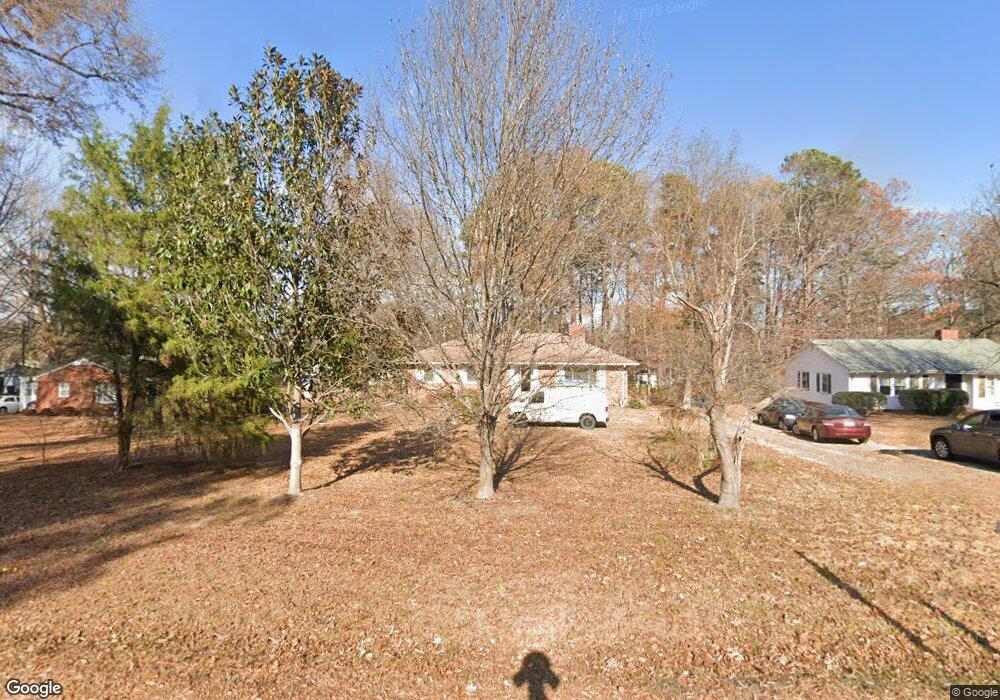
1008 Horton Rd Durham, NC 27704
Duke Homestead NeighborhoodEstimated Value: $324,000 - $344,167
3
Beds
2
Baths
1,580
Sq Ft
$208/Sq Ft
Est. Value
About This Home
This home is located at 1008 Horton Rd, Durham, NC 27704 and is currently estimated at $329,292, approximately $208 per square foot. 1008 Horton Rd is a home located in Durham County with nearby schools including Holt Elementary, George L Carrington Middle, and Northern High School.
Ownership History
Date
Name
Owned For
Owner Type
Purchase Details
Closed on
Aug 31, 2021
Sold by
Beall Hie Ping and The Hie Ping Beall Revocable T
Bought by
Mejm Properties Llc
Current Estimated Value
Home Financials for this Owner
Home Financials are based on the most recent Mortgage that was taken out on this home.
Original Mortgage
$200,000
Outstanding Balance
$42,268
Interest Rate
2.8%
Mortgage Type
Purchase Money Mortgage
Estimated Equity
$287,024
Purchase Details
Closed on
Feb 13, 2018
Sold by
Beall Hie Ping and Harry C Beall Living Trust
Bought by
Beall Hie Ping and Hie Ping Beall Living Trust
Purchase Details
Closed on
May 15, 2008
Sold by
Beall Harry C and Beall Hie Ping
Bought by
Beall Harry C and Beall Hie Ping
Purchase Details
Closed on
Jun 11, 2001
Sold by
Beall Harry C and Beall Hie Ping
Bought by
Misenheimer Ward F and Misenheimer Paulette Ward
Create a Home Valuation Report for This Property
The Home Valuation Report is an in-depth analysis detailing your home's value as well as a comparison with similar homes in the area
Home Values in the Area
Average Home Value in this Area
Purchase History
| Date | Buyer | Sale Price | Title Company |
|---|---|---|---|
| Mejm Properties Llc | $200,000 | None Available | |
| Beall Hie Ping | -- | None Available | |
| Beall Harry C | -- | None Available | |
| Misenheimer Ward F | $40,000 | -- |
Source: Public Records
Mortgage History
| Date | Status | Borrower | Loan Amount |
|---|---|---|---|
| Open | Mejm Properties Llc | $200,000 |
Source: Public Records
Tax History
| Year | Tax Paid | Tax Assessment Tax Assessment Total Assessment is a certain percentage of the fair market value that is determined by local assessors to be the total taxable value of land and additions on the property. | Land | Improvement |
|---|---|---|---|---|
| 2025 | $3,506 | $353,661 | $146,700 | $206,961 |
| 2024 | $3,069 | $220,043 | $48,960 | $171,083 |
| 2023 | $2,882 | $220,043 | $48,960 | $171,083 |
| 2022 | $2,816 | $220,043 | $48,960 | $171,083 |
| 2021 | $2,803 | $220,043 | $48,960 | $171,083 |
| 2020 | $2,737 | $220,043 | $48,960 | $171,083 |
| 2019 | $2,737 | $220,043 | $48,960 | $171,083 |
| 2018 | $2,035 | $150,034 | $24,480 | $125,554 |
| 2017 | $2,020 | $150,034 | $24,480 | $125,554 |
| 2016 | $1,952 | $150,034 | $24,480 | $125,554 |
| 2015 | $1,774 | $128,118 | $24,611 | $103,507 |
| 2014 | $1,774 | $128,118 | $24,611 | $103,507 |
Source: Public Records
Map
Nearby Homes
- 1011 Wyldewood Rd
- 4123 Casa St
- 812 Sanderson Dr
- 805 Northwood Hills Ave
- 1206A River Rock Dr
- 11 Sweetbay Ct
- 812 Chalk Level Rd
- 1419 Cherrycrest Dr
- 1421 Cherrycrest Dr
- 1425 Cherrycrest Dr
- 2207 Elk River Dr
- 1427 Cherrycrest Dr
- 12 Patriot Cir
- 13 Patriot Cir
- 913 Woodside Park Ln
- 1 Signet Dr Unit A17
- 1918 Peppertree St
- 1016 Skyler Ln
- 6 McBenson Place
- 4208 Convergence St
- 1012 Horton Rd
- 1006 Horton Rd
- 1200 Horton Rd
- 1200 Horton Rd Unit parcel
- 933 Garcia Ave
- 1014 Horton Rd
- 1001 Garcia Ave
- 929 Garcia Ave
- 1004 Horton Rd
- 1007 Horton Rd
- 1005 Garcia Ave
- 1009 Horton Rd
- 925 Garcia Ave
- 1005 Horton Rd
- 1016 Horton Rd
- 1003 Horton Rd
- 1002 Horton Rd
- 2 Gable Ct
- 1002 Garcia Ave
- 1013 Horton Rd
Your Personal Tour Guide
Ask me questions while you tour the home.