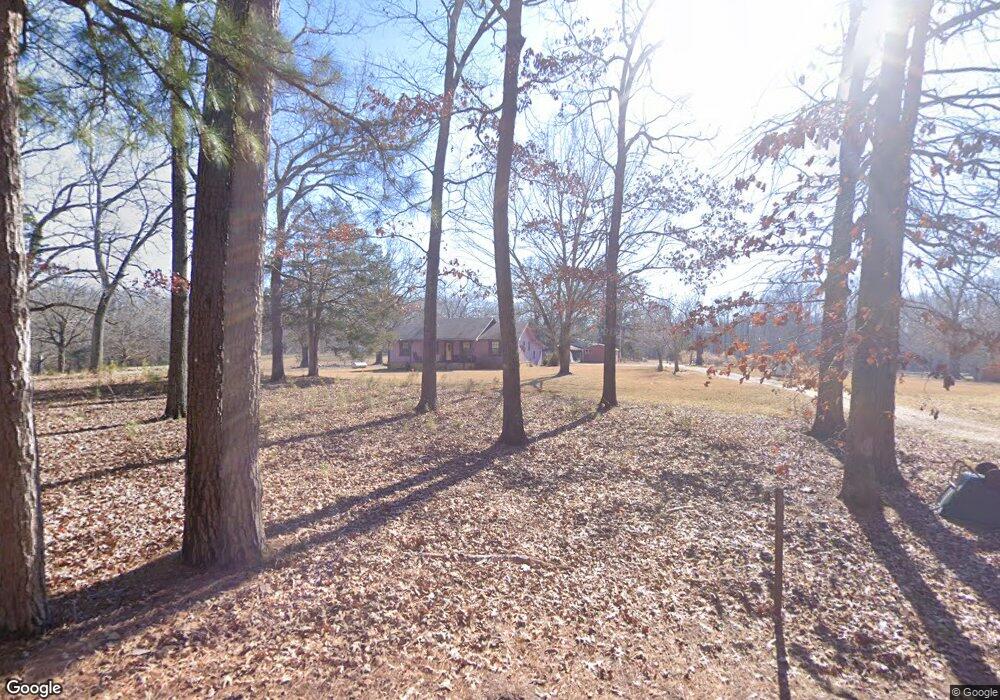
1008 John George Loop Michie, TN 38357
Estimated Value: $158,000 - $202,000
Studio
2
Baths
1,464
Sq Ft
$122/Sq Ft
Est. Value
About This Home
This home is located at 1008 John George Loop, Michie, TN 38357 and is currently estimated at $178,277, approximately $121 per square foot. 1008 John George Loop is a home located in McNairy County with nearby schools including Michie Elementary School, Ramer Elementary School, and Selmer Elementary School.
Ownership History
Date
Name
Owned For
Owner Type
Purchase Details
Closed on
Mar 31, 2025
Sold by
Qualls Gerald and Qualls Tracy
Bought by
Malone Shelby
Current Estimated Value
Home Financials for this Owner
Home Financials are based on the most recent Mortgage that was taken out on this home.
Original Mortgage
$143,050
Outstanding Balance
$142,315
Interest Rate
6.85%
Mortgage Type
New Conventional
Estimated Equity
$35,962
Purchase Details
Closed on
Nov 22, 2024
Sold by
Chancery Court Of Mcnairy County and Boals Kim
Bought by
Qualls Gerald and Qualls Tracy
Purchase Details
Closed on
Apr 3, 2005
Sold by
Carl Qualls
Bought by
Charles Qualls
Purchase Details
Closed on
Nov 20, 1997
Sold by
Gerald Qualls
Bought by
Gerald Qualls
Purchase Details
Closed on
Feb 28, 1997
Sold by
Carl Qualls
Bought by
Gerald Qualls
Create a Home Valuation Report for This Property
The Home Valuation Report is an in-depth analysis detailing your home's value as well as a comparison with similar homes in the area
Purchase History
| Date | Buyer | Sale Price | Title Company |
|---|---|---|---|
| Malone Shelby | $155,000 | None Listed On Document | |
| Malone Shelby | $155,000 | None Listed On Document | |
| Qualls Gerald | $112,600 | None Listed On Document | |
| Charles Qualls | -- | -- | |
| Gerald Qualls | $15,300 | -- | |
| Gerald Qualls | $500 | -- |
Source: Public Records
Mortgage History
| Date | Status | Borrower | Loan Amount |
|---|---|---|---|
| Open | Malone Shelby | $143,050 | |
| Closed | Malone Shelby | $143,050 |
Source: Public Records
Tax History
| Year | Tax Paid | Tax Assessment Tax Assessment Total Assessment is a certain percentage of the fair market value that is determined by local assessors to be the total taxable value of land and additions on the property. | Land | Improvement |
|---|---|---|---|---|
| 2025 | $444 | $28,125 | $2,000 | $26,125 |
| 2024 | $444 | $28,150 | $2,025 | $26,125 |
| 2023 | $444 | $28,150 | $2,025 | $26,125 |
| 2022 | $444 | $28,150 | $2,025 | $26,125 |
| 2021 | $309 | $15,100 | $2,025 | $13,075 |
| 2020 | $306 | $14,975 | $2,025 | $12,950 |
| 2019 | $306 | $14,975 | $2,025 | $12,950 |
| 2018 | $306 | $14,975 | $2,025 | $12,950 |
| 2017 | $306 | $14,975 | $2,025 | $12,950 |
| 2016 | $300 | $14,975 | $2,025 | $12,950 |
| 2015 | $313 | $14,975 | $2,025 | $12,950 |
| 2014 | $324 | $15,525 | $2,250 | $13,275 |
Source: Public Records
Map
Nearby Homes
- 820 John George Loop
- 10137 Tennessee 22
- 10057 Tennessee 22
- 211 Glenmore St
- 106 Afton Dr
- 1 Northtowne Dr
- 3 Northtowne Dr
- Lot 6 Northtown Dr
- Lot 12 Northtown Dr
- Lot 4 Northtown Dr
- Lot 5 Northtown Dr
- Lot 2 Northtown Dr
- Lot 11 Northtown Dr
- Lot 8 Northtown Dr
- Lot 16 Northtown Dr
- Lot 14 Northtown Dr
- Lot 7 Northtown Dr
- Lot 9 Northtown Dr
- Lot 15 Northtown Dr
- Lot 10 Northtown Dr
- 993 John George Loop
- 1210 John George Loop
- 1101 John George Loop
- 1079 John George Loop
- 1171 John George Loop
- 1123 John George Loop
- 1345 John George Loop
- 400 John George Loop
- 0 John George Loop Unit 9957003
- 0 John George Loop Unit 10202475
- 0 John George Loop Unit 25-2649
- LOT 3 John George Loop
- LOT 2 John George Loop
- LOT 1 John George Loop
- 431 John George Loop
- 173 State Line Rd
- 1128 Davis Yancey Rd
- 195 State Line Rd
- 187 State Line Rd
- 185 State Line Rd
Your Personal Tour Guide
Ask me questions while you tour the home.