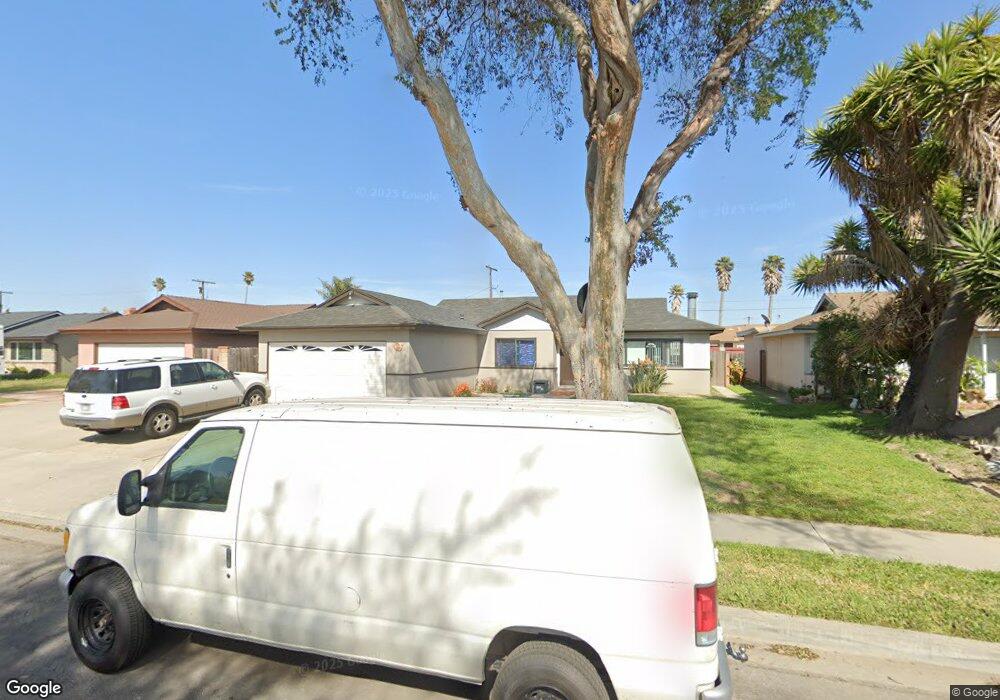
1008 N Daisy St Lompoc, CA 93436
Estimated Value: $549,000 - $575,000
3
Beds
2
Baths
1,139
Sq Ft
$492/Sq Ft
Est. Value
About This Home
This home is located at 1008 N Daisy St, Lompoc, CA 93436 and is currently estimated at $560,926, approximately $492 per square foot. 1008 N Daisy St is a home located in Santa Barbara County with nearby schools including La Honda STEAM Academy, Cabrillo High School, and Olive Grove Charter - Lompoc.
Ownership History
Date
Name
Owned For
Owner Type
Purchase Details
Closed on
Oct 25, 2023
Sold by
Kim R Theis Revocable Trust
Bought by
Ferguson Michael L
Current Estimated Value
Home Financials for this Owner
Home Financials are based on the most recent Mortgage that was taken out on this home.
Original Mortgage
$515,490
Outstanding Balance
$505,468
Interest Rate
7.18%
Mortgage Type
FHA
Estimated Equity
$55,458
Purchase Details
Closed on
Nov 17, 2022
Sold by
Theis Kim Rae
Bought by
Kim R Theis Revocable Trust
Purchase Details
Closed on
Jun 23, 2022
Sold by
Wolf Dawn V
Bought by
Theis Kim Rae
Home Financials for this Owner
Home Financials are based on the most recent Mortgage that was taken out on this home.
Original Mortgage
$190,000
Interest Rate
5.23%
Mortgage Type
New Conventional
Create a Home Valuation Report for This Property
The Home Valuation Report is an in-depth analysis detailing your home's value as well as a comparison with similar homes in the area
Home Values in the Area
Average Home Value in this Area
Purchase History
| Date | Buyer | Sale Price | Title Company |
|---|---|---|---|
| Ferguson Michael L | $525,000 | Fidelity National Title Compan | |
| Kim R Theis Revocable Trust | -- | -- | |
| Theis Kim Rae | $466,000 | Fidelity National Title |
Source: Public Records
Mortgage History
| Date | Status | Borrower | Loan Amount |
|---|---|---|---|
| Open | Ferguson Michael L | $515,490 | |
| Previous Owner | Theis Kim Rae | $190,000 |
Source: Public Records
Tax History
| Year | Tax Paid | Tax Assessment Tax Assessment Total Assessment is a certain percentage of the fair market value that is determined by local assessors to be the total taxable value of land and additions on the property. | Land | Improvement |
|---|---|---|---|---|
| 2025 | $5,823 | $535,500 | $173,400 | $362,100 |
| 2023 | $5,823 | $466,000 | $150,000 | $316,000 |
| 2022 | $2,733 | $238,675 | $70,713 | $167,962 |
| 2021 | $2,763 | $233,996 | $69,327 | $164,669 |
| 2020 | $2,733 | $231,598 | $68,617 | $162,981 |
| 2019 | $2,688 | $227,058 | $67,272 | $159,786 |
| 2018 | $2,647 | $222,606 | $65,953 | $156,653 |
| 2017 | $2,599 | $218,242 | $64,660 | $153,582 |
| 2016 | $2,552 | $213,964 | $63,393 | $150,571 |
| 2014 | $2,497 | $206,623 | $61,218 | $145,405 |
Source: Public Records
Map
Nearby Homes
- 1100 N Third St
- 1127 Bell Ave
- 1704 E Nectarine Ave
- 601 N Seventh St
- 701 E Pine Ave Unit 182
- 701 E Pine Ave Unit 176
- 701 E Pine Ave Unit 171
- 701 E Pine Ave Unit 161
- 516 N 2nd St
- 622 N B St
- 610 E Pine Ave Unit 10
- 610 E Pine Ave Unit 29
- 610 E Pine Ave Unit 62
- 505 N 1st St
- 1735 River Vista Way
- 824 Cooper Dr
- 321 N Third St
- E Highway 246
- 1725 Autumn Sage Place
- 1741 River Vista Way
Your Personal Tour Guide
Ask me questions while you tour the home.