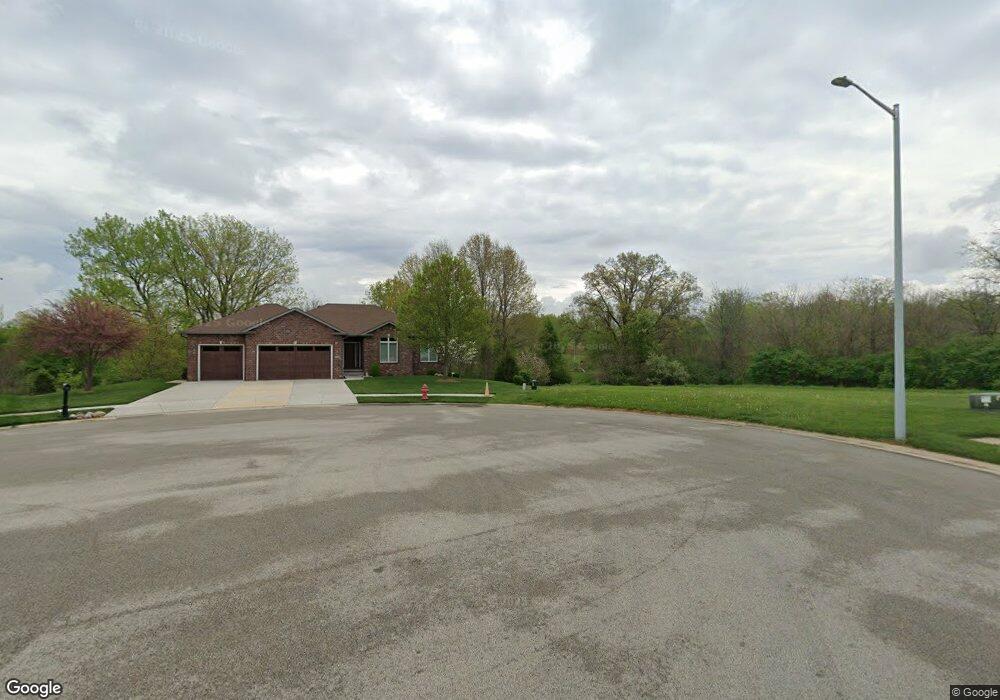
1008 Pheasant Run Sherman, IL 62684
Estimated Value: $411,000 - $458,000
--
Bed
--
Bath
--
Sq Ft
0.42
Acres
About This Home
This home is located at 1008 Pheasant Run, Sherman, IL 62684 and is currently estimated at $432,831. 1008 Pheasant Run is a home with nearby schools including Sherman Elementary School, Williamsville Jr High School, and Williamsville High School.
Ownership History
Date
Name
Owned For
Owner Type
Purchase Details
Closed on
Dec 17, 2013
Current Estimated Value
Purchase Details
Closed on
Nov 15, 2013
Create a Home Valuation Report for This Property
The Home Valuation Report is an in-depth analysis detailing your home's value as well as a comparison with similar homes in the area
Home Values in the Area
Average Home Value in this Area
Purchase History
| Date | Buyer | Sale Price | Title Company |
|---|---|---|---|
| -- | $54,000 | -- | |
| -- | -- | -- |
Source: Public Records
Tax History Compared to Growth
Tax History
| Year | Tax Paid | Tax Assessment Tax Assessment Total Assessment is a certain percentage of the fair market value that is determined by local assessors to be the total taxable value of land and additions on the property. | Land | Improvement |
|---|---|---|---|---|
| 2024 | $8,598 | $132,739 | $25,052 | $107,687 |
| 2023 | $8,246 | $122,782 | $23,173 | $99,609 |
| 2022 | $7,872 | $114,364 | $21,584 | $92,780 |
| 2021 | $7,740 | $109,033 | $20,578 | $88,455 |
| 2020 | $7,537 | $106,780 | $20,153 | $86,627 |
| 2019 | $7,289 | $105,975 | $20,001 | $85,974 |
| 2018 | $7,496 | $105,364 | $19,886 | $85,478 |
| 2017 | $7,296 | $104,208 | $19,668 | $84,540 |
| 2016 | $7,149 | $101,716 | $19,198 | $82,518 |
| 2015 | $6,987 | $100,391 | $18,948 | $81,443 |
| 2014 | $3,169 | $118,803 | $18,247 | $100,556 |
| 2013 | -- | $0 | $0 | $0 |
Source: Public Records
Map
Nearby Homes
- 1201 Saratoga Chase
- 1309 Arlington Chase
- 355 Turtle Dove Dr
- 4 Red Bud Run
- 710 Timber Edge Dr
- 255 Possum Pass Ct
- 716 Old Tipton School Rd Unit 1
- 1100 Lightstone Ct
- 0 S Sherman Blvd
- 1109 Lightstone Ct
- 0 Cabin Smoke Trail
- 1215 Golf Crest Ct
- 1237 Golf Crest Ct
- 40 Woods Mill Rd
- 105 Illini Blvd
- 101 Illini Blvd
- 20 Hickory Ridge Ln Unit 1
- 4600 Bachmann Dr
- 3500 N Dirksen Pkwy Unit 225
- 3500 N Dirksen Pkwy Unit 204
- 1004 Pheasant Run
- 1000 Pheasant Run
- 1009 Pheasant Run
- 916 Pheasant Run
- 923 Pheasant Run
- 919 Pheasant Run
- 26 Georgetowne Rd Unit 1
- 30 Georgetowne Rd Unit 1
- 731 Pheasant Run
- 727 Pheasant Run
- 735 Pheasant Run
- 723 Pheasant Run
- 981 Gooseneck Trail
- 1095 S 1st St
- 1081 S 1st St
- 980 Gooseneck Trail
- 1115 S 1st St
- 971 Gooseneck Trail
- 31 Georgetowne Rd Unit 1
- 1065 S 1st St