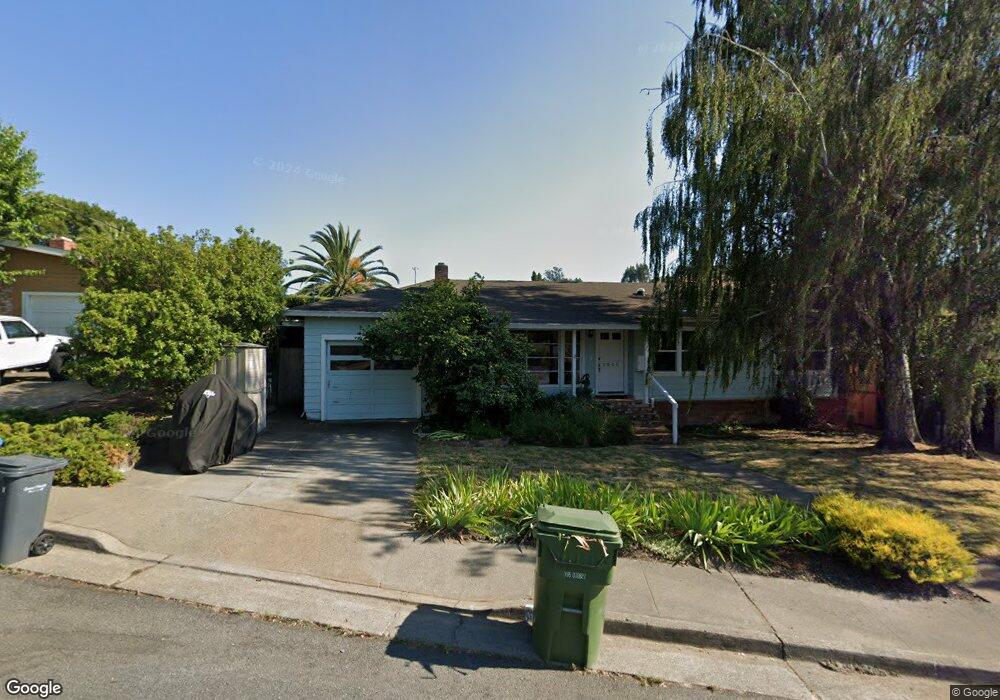
1008 Phillips Ave Petaluma, CA 94952
Western Petaluma NeighborhoodEstimated Value: $918,177 - $1,166,000
2
Beds
2
Baths
2,103
Sq Ft
$512/Sq Ft
Est. Value
About This Home
This home is located at 1008 Phillips Ave, Petaluma, CA 94952 and is currently estimated at $1,077,544, approximately $512 per square foot. 1008 Phillips Ave is a home located in Sonoma County with nearby schools including Grant Elementary School, Petaluma Junior High School, and Petaluma High School.
Ownership History
Date
Name
Owned For
Owner Type
Purchase Details
Closed on
Oct 4, 2007
Sold by
Burns Deborah A and Brentwood Burns Deborah
Bought by
Burns Deborah A
Current Estimated Value
Home Financials for this Owner
Home Financials are based on the most recent Mortgage that was taken out on this home.
Original Mortgage
$380,000
Outstanding Balance
$239,584
Interest Rate
6.4%
Mortgage Type
New Conventional
Estimated Equity
$837,960
Purchase Details
Closed on
Mar 15, 2007
Sold by
Burns Dal
Bought by
Brentwood Burns Deborah
Purchase Details
Closed on
May 9, 2000
Sold by
Brentwood Deborah A and Brentwood Deborah A
Bought by
Burns Dal and Brentwood Burns Deborah A
Home Financials for this Owner
Home Financials are based on the most recent Mortgage that was taken out on this home.
Original Mortgage
$100,000
Interest Rate
8.22%
Mortgage Type
Credit Line Revolving
Purchase Details
Closed on
Dec 21, 1995
Sold by
Brentwood Deborah A
Bought by
Brentwood Deborah A
Create a Home Valuation Report for This Property
The Home Valuation Report is an in-depth analysis detailing your home's value as well as a comparison with similar homes in the area
Home Values in the Area
Average Home Value in this Area
Purchase History
| Date | Buyer | Sale Price | Title Company |
|---|---|---|---|
| Burns Deborah A | -- | First American Title | |
| Brentwood Burns Deborah | -- | None Available | |
| Burns Dal | -- | Chicago Title Co | |
| Brentwood Deborah A | -- | First American Title |
Source: Public Records
Mortgage History
| Date | Status | Borrower | Loan Amount |
|---|---|---|---|
| Open | Burns Deborah A | $380,000 | |
| Closed | Burns Dal | $100,000 |
Source: Public Records
Tax History
| Year | Tax Paid | Tax Assessment Tax Assessment Total Assessment is a certain percentage of the fair market value that is determined by local assessors to be the total taxable value of land and additions on the property. | Land | Improvement |
|---|---|---|---|---|
| 2025 | $1,257 | $104,187 | $20,077 | $84,110 |
| 2024 | $1,257 | $102,145 | $19,684 | $82,461 |
| 2023 | $1,257 | $100,144 | $19,299 | $80,845 |
| 2022 | $1,144 | $98,181 | $18,921 | $79,260 |
| 2021 | $1,124 | $96,256 | $18,550 | $77,706 |
| 2020 | $1,131 | $95,270 | $18,360 | $76,910 |
| 2019 | $1,118 | $93,402 | $18,000 | $75,402 |
| 2018 | $1,112 | $91,572 | $17,648 | $73,924 |
| 2017 | $1,090 | $89,777 | $17,302 | $72,475 |
| 2016 | $1,056 | $88,017 | $16,963 | $71,054 |
| 2015 | $1,042 | $86,696 | $16,709 | $69,987 |
| 2014 | $1,036 | $84,999 | $16,382 | $68,617 |
Source: Public Records
Map
Nearby Homes
- 28 Meadowglen Dr
- 45 Augusta Cir
- 113 Greenridge Ct
- 21 Branching Way
- 1193 Brighton View Cir
- 540 Sapphire St
- 720 Petaluma Blvd S Unit 28
- 134 Grevillia Dr
- 22 Oak Knoll Ct
- 618 E St
- 1309 D Street Extension
- 426 1st St
- 16 7th St
- 11 10th St
- 0 Lakeville St
- 315 Lakeville St
- 843 Cedarwood Ln
- 100 Orchard Ln
- 320 Vallejo St
- 12 Haven Dr
- 1006 Phillips Ave
- 1010 Phillips Ave
- 1362 Canyon Dr
- 1225 Mountain View Ave
- 1358 Canyon Dr
- 1191 Mountain View Ave
- 1101 Mountain View Ave
- 1014 Phillips Ave
- 1009 Phillips Ave
- 1354 Canyon Dr
- 1229 Mountain View Ave
- 1007 Phillips Ave
- 1005 Phillips Ave
- 1015 Phillips Ave
- 1350 Canyon Dr
- 1009 Mountain View Ave
- 1020 Mcnear Ave
- 1024 Mcnear Ave
- 1016 Mcnear Ave
Your Personal Tour Guide
Ask me questions while you tour the home.