Estimated Value: $263,488 - $359,000
3
Beds
2
Baths
1,862
Sq Ft
$169/Sq Ft
Est. Value
About This Home
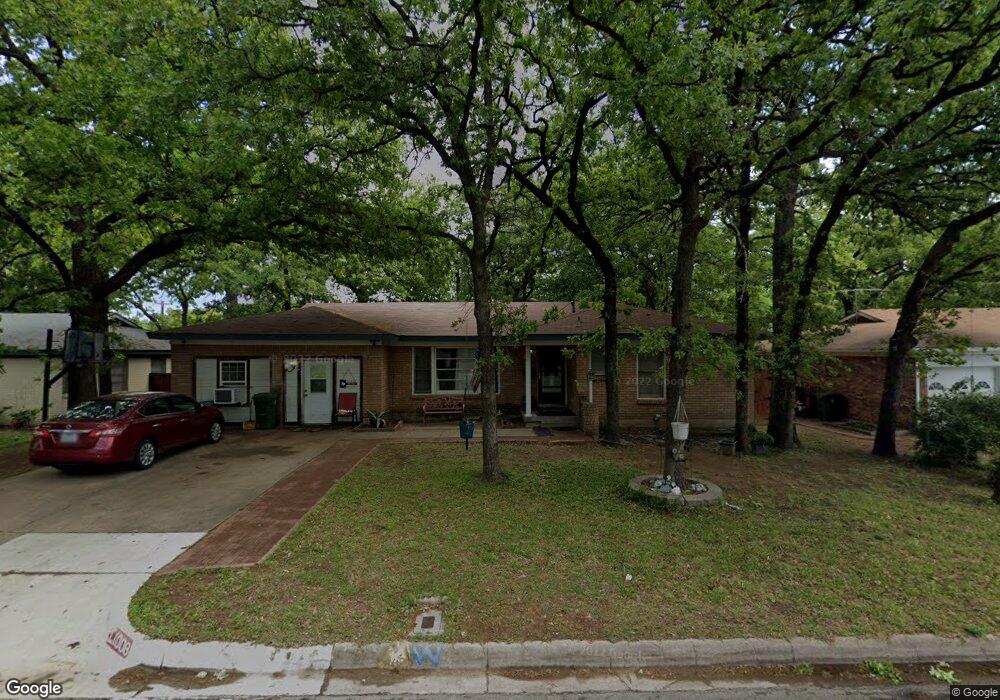
This home is located at 1008 Reed St, Hurst, TX 76053 and is currently estimated at $313,872, approximately $168 per square foot. 1008 Reed St is a home located in Tarrant County with nearby schools including Harrison Lane Elementary School, Hurst J High School, and L.D. Bell High School.
Ownership History
Date
Name
Owned For
Owner Type
Purchase Details
Closed on
Oct 6, 1998
Sold by
Holland Douglas C and Holland Cecilia D
Bought by
Stamper Anthony
Current Estimated Value
Home Financials for this Owner
Home Financials are based on the most recent Mortgage that was taken out on this home.
Original Mortgage
$72,626
Outstanding Balance
$15,928
Interest Rate
6.92%
Mortgage Type
FHA
Estimated Equity
$297,944
Create a Home Valuation Report for This Property
The Home Valuation Report is an in-depth analysis detailing your home's value as well as a comparison with similar homes in the area
Home Values in the Area
Average Home Value in this Area
Purchase History
| Date | Buyer | Sale Price | Title Company |
|---|---|---|---|
| Stamper Anthony | -- | Commonwealth Land Title |
Source: Public Records
Mortgage History
| Date | Status | Borrower | Loan Amount |
|---|---|---|---|
| Open | Stamper Anthony | $72,626 |
Source: Public Records
Tax History Compared to Growth
Tax History
| Year | Tax Paid | Tax Assessment Tax Assessment Total Assessment is a certain percentage of the fair market value that is determined by local assessors to be the total taxable value of land and additions on the property. | Land | Improvement |
|---|---|---|---|---|
| 2025 | $3,266 | $378,387 | $65,000 | $313,387 |
| 2024 | $3,266 | $378,387 | $65,000 | $313,387 |
| 2023 | $4,221 | $358,875 | $40,000 | $318,875 |
| 2022 | $4,411 | $269,885 | $40,000 | $229,885 |
| 2021 | $4,200 | $238,316 | $40,000 | $198,316 |
| 2020 | $3,809 | $205,106 | $40,000 | $165,106 |
| 2019 | $3,522 | $195,760 | $40,000 | $155,760 |
| 2018 | $2,669 | $130,837 | $19,000 | $111,837 |
| 2017 | $3,010 | $141,709 | $19,000 | $122,709 |
| 2016 | $2,736 | $125,497 | $19,000 | $106,497 |
| 2015 | $2,184 | $98,300 | $15,000 | $83,300 |
| 2014 | $2,184 | $98,300 | $15,000 | $83,300 |
Source: Public Records
Map
Nearby Homes