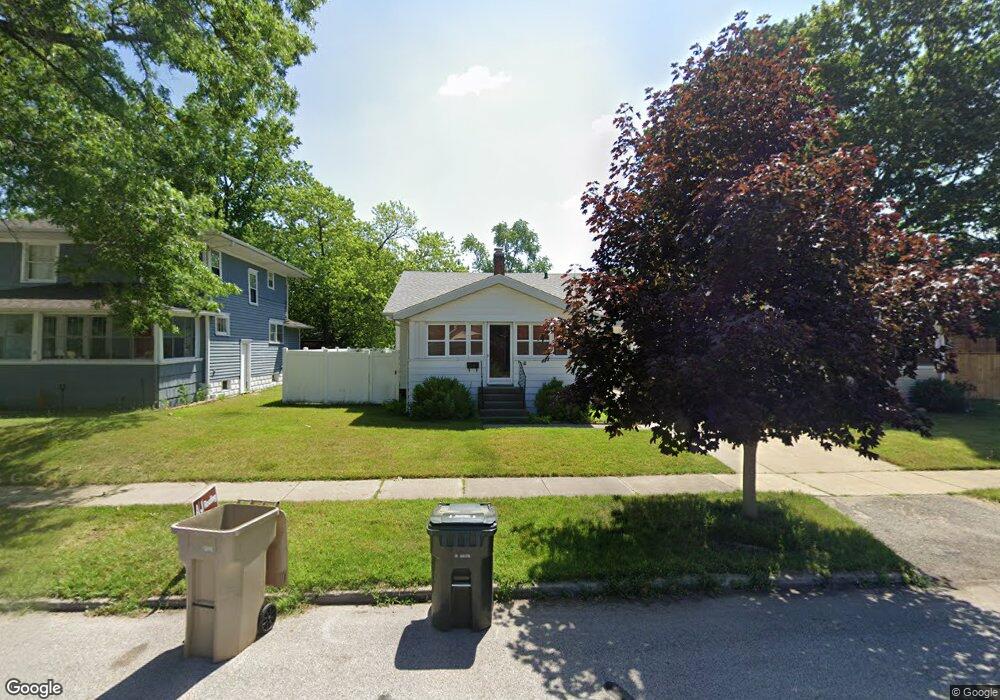
1008 S 25th St South Bend, IN 46615
River Park NeighborhoodEstimated Value: $137,000 - $148,942
2
Beds
1
Bath
888
Sq Ft
$161/Sq Ft
Est. Value
About This Home
This home is located at 1008 S 25th St, South Bend, IN 46615 and is currently estimated at $142,986, approximately $161 per square foot. 1008 S 25th St is a home located in St. Joseph County with nearby schools including Nuner Fine Arts Academy, Clay Intermediate Center, and Jefferson Intermediate Traditional School.
Ownership History
Date
Name
Owned For
Owner Type
Purchase Details
Closed on
Jun 17, 2016
Sold by
Moore Janice R
Bought by
Moore Devin D
Current Estimated Value
Purchase Details
Closed on
Nov 13, 2009
Sold by
Hacker Evelyn M
Bought by
Moore Devin D and Moore Janice R
Home Financials for this Owner
Home Financials are based on the most recent Mortgage that was taken out on this home.
Original Mortgage
$65,292
Outstanding Balance
$42,415
Interest Rate
4.9%
Mortgage Type
FHA
Estimated Equity
$100,571
Create a Home Valuation Report for This Property
The Home Valuation Report is an in-depth analysis detailing your home's value as well as a comparison with similar homes in the area
Home Values in the Area
Average Home Value in this Area
Purchase History
| Date | Buyer | Sale Price | Title Company |
|---|---|---|---|
| Moore Devin D | -- | -- | |
| Moore Devin D | -- | Meridian Title Corp |
Source: Public Records
Mortgage History
| Date | Status | Borrower | Loan Amount |
|---|---|---|---|
| Open | Moore Devin D | $65,292 |
Source: Public Records
Tax History Compared to Growth
Tax History
| Year | Tax Paid | Tax Assessment Tax Assessment Total Assessment is a certain percentage of the fair market value that is determined by local assessors to be the total taxable value of land and additions on the property. | Land | Improvement |
|---|---|---|---|---|
| 2024 | $1,435 | $134,600 | $6,100 | $128,500 |
| 2023 | $1,147 | $122,100 | $6,100 | $116,000 |
| 2022 | $1,190 | $101,300 | $6,100 | $95,200 |
| 2021 | $1,058 | $90,800 | $3,900 | $86,900 |
| 2020 | $894 | $77,800 | $3,300 | $74,500 |
| 2019 | $715 | $67,200 | $2,700 | $64,500 |
| 2018 | $633 | $57,500 | $2,300 | $55,200 |
| 2017 | $640 | $56,800 | $2,300 | $54,500 |
| 2016 | $649 | $56,800 | $2,300 | $54,500 |
| 2014 | $602 | $55,700 | $2,300 | $53,400 |
Source: Public Records
Map
Nearby Homes
- 1017 S 23rd St
- 1111 S 27th St
- 815 S 26th St
- 806 S 26th St
- 205 N Middleboro Ave
- 137 Monmoor Ave
- 634 S 26th St
- 1226 S 30th St
- 737 S 30th St
- 537 S 27th St
- 513 S 26th St
- 525 S 28th St
- 510 S Ironwood Dr
- 2416 Milburn Blvd
- 2710 Milburn Blvd
- 3312 Mishawaka Ave
- 2204 Milburn Blvd
- 1229 S 34th St
- 1902 Randolph St
- 930 S 34th St