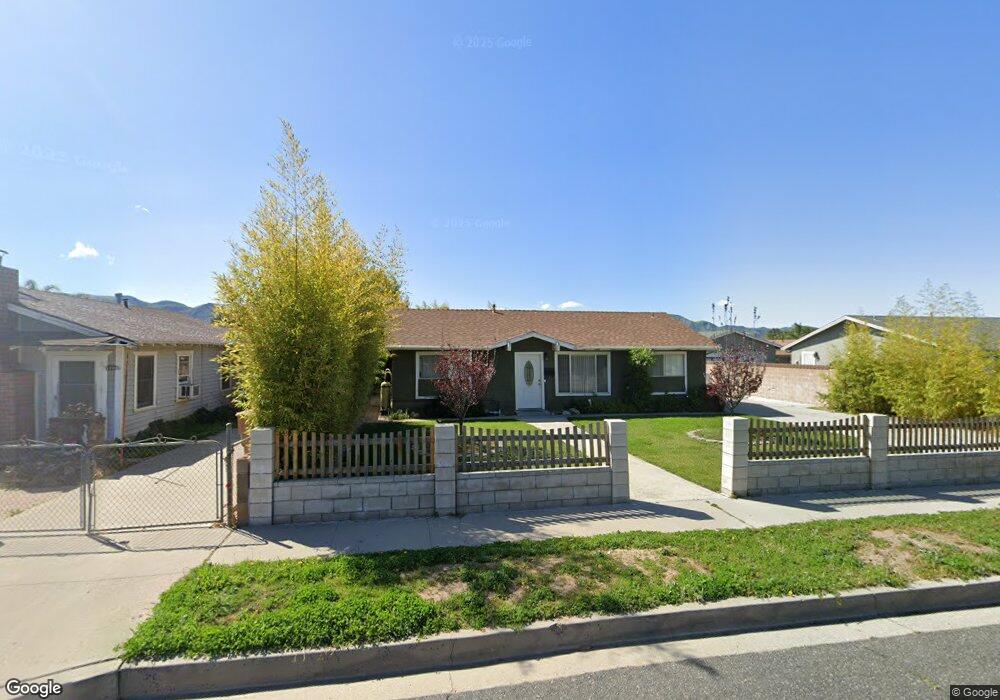
1008 Sespe Ave Fillmore, CA 93015
Estimated Value: $568,000 - $677,000
3
Beds
2
Baths
1,120
Sq Ft
$557/Sq Ft
Est. Value
About This Home
This home is located at 1008 Sespe Ave, Fillmore, CA 93015 and is currently estimated at $623,813, approximately $556 per square foot. 1008 Sespe Ave is a home located in Ventura County with nearby schools including Fillmore Senior High.
Ownership History
Date
Name
Owned For
Owner Type
Purchase Details
Closed on
Jun 16, 2025
Sold by
Salazar Efrain
Bought by
Salazar Trust and Salazar
Current Estimated Value
Purchase Details
Closed on
Nov 22, 2010
Sold by
Salazar Jeanette
Bought by
Salazar Efrain
Home Financials for this Owner
Home Financials are based on the most recent Mortgage that was taken out on this home.
Original Mortgage
$237,869
Interest Rate
4.25%
Mortgage Type
FHA
Purchase Details
Closed on
Nov 10, 2009
Sold by
Department Of Veterans Affairs
Bought by
Vargas Herman R and Vargas Martha A
Home Financials for this Owner
Home Financials are based on the most recent Mortgage that was taken out on this home.
Original Mortgage
$235,653
Interest Rate
4.78%
Mortgage Type
FHA
Purchase Details
Closed on
Oct 27, 2009
Sold by
Vargas Herman and Vargas Martha
Bought by
Salazar Efrain and Salazar Jeanette
Home Financials for this Owner
Home Financials are based on the most recent Mortgage that was taken out on this home.
Original Mortgage
$235,653
Interest Rate
4.78%
Mortgage Type
FHA
Create a Home Valuation Report for This Property
The Home Valuation Report is an in-depth analysis detailing your home's value as well as a comparison with similar homes in the area
Home Values in the Area
Average Home Value in this Area
Purchase History
| Date | Buyer | Sale Price | Title Company |
|---|---|---|---|
| Salazar Trust | -- | None Listed On Document | |
| Salazar Efrain | $119,000 | Fidelity National Title Co | |
| Vargas Herman R | -- | None Available | |
| Salazar Efrain | $240,000 | Fidelity National Title Co |
Source: Public Records
Mortgage History
| Date | Status | Borrower | Loan Amount |
|---|---|---|---|
| Previous Owner | Salazar Efrain | $237,869 | |
| Previous Owner | Salazar Efrain | $235,653 |
Source: Public Records
Tax History Compared to Growth
Tax History
| Year | Tax Paid | Tax Assessment Tax Assessment Total Assessment is a certain percentage of the fair market value that is determined by local assessors to be the total taxable value of land and additions on the property. | Land | Improvement |
|---|---|---|---|---|
| 2025 | $3,371 | $309,782 | $154,892 | $154,890 |
| 2024 | $3,371 | $303,708 | $151,855 | $151,853 |
| 2023 | $3,324 | $297,753 | $148,877 | $148,876 |
| 2022 | $3,071 | $291,915 | $145,958 | $145,957 |
| 2021 | $3,491 | $286,192 | $143,096 | $143,096 |
| 2020 | $3,238 | $283,260 | $141,630 | $141,630 |
| 2019 | $3,246 | $277,706 | $138,853 | $138,853 |
| 2018 | $3,180 | $272,262 | $136,131 | $136,131 |
| 2017 | $3,197 | $266,924 | $133,462 | $133,462 |
| 2016 | $2,958 | $261,692 | $130,846 | $130,846 |
| 2015 | $2,875 | $257,764 | $128,882 | $128,882 |
| 2014 | $2,872 | $252,716 | $126,358 | $126,358 |
Source: Public Records
Map
Nearby Homes
- 1050 King St
- 300 C St
- 232 Village Square
- 600 C St
- 1032 Meadowlark Dr
- 1028 Meadowlark Dr
- 939 Meadowlark Dr
- 1062 Meadowlark Dr
- 803 Sespe Ave
- 621 Lemon Way
- 320 D St
- 245 D St
- 863 Santa fe St
- 62 Rio Grande St
- 241 Cottonwood Ln
- 660 River St Unit D
- 569 Grapefruit Ln
- 595 Heritage Valley Pkwy
- 340 Central Ave
- 89 Willow St