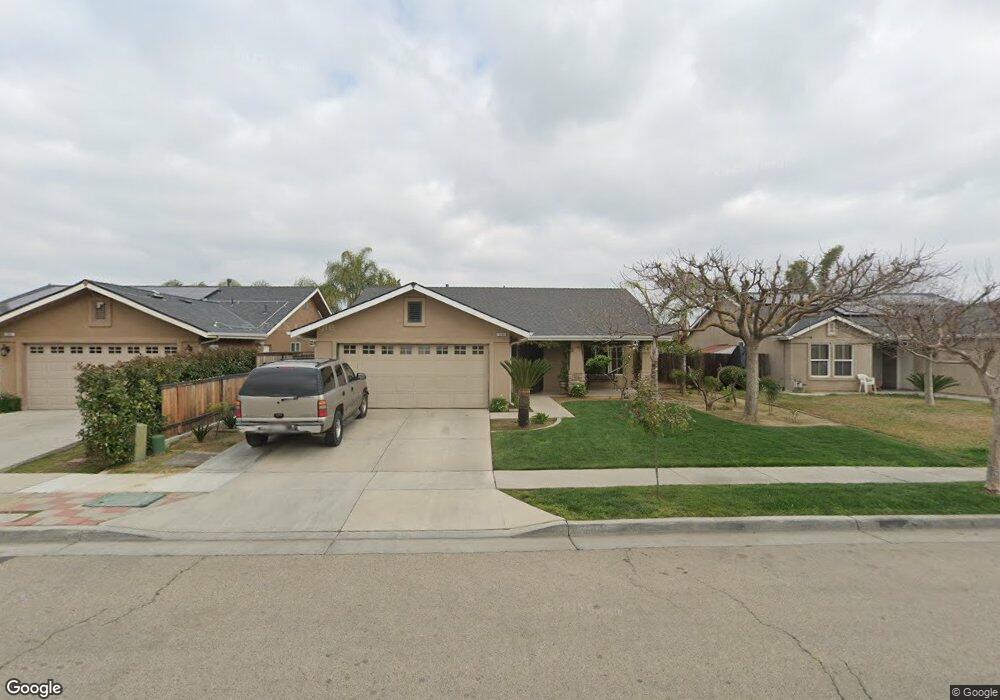
1008 Skylar Ave Sanger, CA 93657
Estimated Value: $302,189 - $356,000
3
Beds
2
Baths
1,197
Sq Ft
$273/Sq Ft
Est. Value
About This Home
This home is located at 1008 Skylar Ave, Sanger, CA 93657 and is currently estimated at $327,063, approximately $273 per square foot. 1008 Skylar Ave is a home located in Fresno County with nearby schools including Jefferson Elementary School, Washington Academic Middle School, and Sanger High School.
Ownership History
Date
Name
Owned For
Owner Type
Purchase Details
Closed on
Aug 12, 2009
Sold by
Mission Development 5426 Lp
Bought by
Ponce Rosendo and Ponce Maria
Current Estimated Value
Home Financials for this Owner
Home Financials are based on the most recent Mortgage that was taken out on this home.
Original Mortgage
$133,292
Outstanding Balance
$86,374
Interest Rate
5.09%
Mortgage Type
FHA
Estimated Equity
$240,690
Create a Home Valuation Report for This Property
The Home Valuation Report is an in-depth analysis detailing your home's value as well as a comparison with similar homes in the area
Home Values in the Area
Average Home Value in this Area
Purchase History
| Date | Buyer | Sale Price | Title Company |
|---|---|---|---|
| Ponce Rosendo | $155,000 | First American Title Company |
Source: Public Records
Mortgage History
| Date | Status | Borrower | Loan Amount |
|---|---|---|---|
| Open | Ponce Rosendo | $133,292 |
Source: Public Records
Tax History
| Year | Tax Paid | Tax Assessment Tax Assessment Total Assessment is a certain percentage of the fair market value that is determined by local assessors to be the total taxable value of land and additions on the property. | Land | Improvement |
|---|---|---|---|---|
| 2025 | $2,539 | $205,643 | $45,172 | $160,471 |
| 2023 | $2,375 | $197,660 | $43,419 | $154,241 |
| 2022 | $2,338 | $193,785 | $42,568 | $151,217 |
| 2021 | $2,393 | $189,986 | $41,734 | $148,252 |
| 2020 | $2,325 | $188,039 | $41,307 | $146,732 |
| 2019 | $2,218 | $179,353 | $40,498 | $138,855 |
| 2018 | $2,128 | $175,837 | $39,704 | $136,133 |
| 2017 | $2,091 | $172,390 | $38,926 | $133,464 |
| 2016 | $1,969 | $169,011 | $38,163 | $130,848 |
| 2015 | $1,984 | $166,473 | $37,590 | $128,883 |
| 2014 | $1,957 | $163,213 | $36,854 | $126,359 |
Source: Public Records
Map
Nearby Homes
Your Personal Tour Guide
Ask me questions while you tour the home.