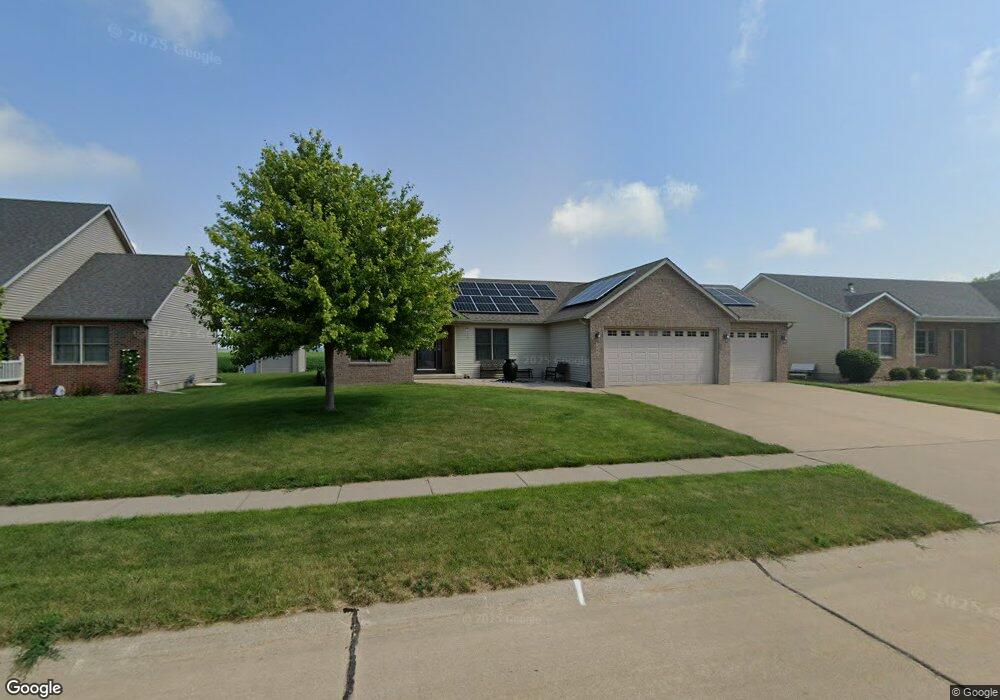
1008 W Scott St Eldridge, IA 52748
Estimated Value: $441,000 - $520,000
4
Beds
5
Baths
1,954
Sq Ft
$248/Sq Ft
Est. Value
About This Home
This home is located at 1008 W Scott St, Eldridge, IA 52748 and is currently estimated at $483,775, approximately $247 per square foot. 1008 W Scott St is a home located in Scott County with nearby schools including Edward White Elementary School, North Scott Junior High School, and North Scott Senior High School.
Ownership History
Date
Name
Owned For
Owner Type
Purchase Details
Closed on
Feb 21, 2020
Sold by
Loussaert Jennifer
Bought by
Loussaert Michael L
Current Estimated Value
Purchase Details
Closed on
Jul 31, 2015
Sold by
Decker Todd M
Bought by
Loussaert Michael E and Loussaert Jennifer J
Home Financials for this Owner
Home Financials are based on the most recent Mortgage that was taken out on this home.
Original Mortgage
$175,000
Interest Rate
3.12%
Mortgage Type
Adjustable Rate Mortgage/ARM
Purchase Details
Closed on
Feb 24, 2011
Sold by
Tobin Brian J
Bought by
Decker Todd M
Home Financials for this Owner
Home Financials are based on the most recent Mortgage that was taken out on this home.
Original Mortgage
$150,000
Interest Rate
4.76%
Mortgage Type
New Conventional
Purchase Details
Closed on
Jun 23, 2006
Sold by
Tobin Brothers Construction Inc
Bought by
Tobin Brian J
Create a Home Valuation Report for This Property
The Home Valuation Report is an in-depth analysis detailing your home's value as well as a comparison with similar homes in the area
Home Values in the Area
Average Home Value in this Area
Purchase History
| Date | Buyer | Sale Price | Title Company |
|---|---|---|---|
| Loussaert Michael L | -- | None Available | |
| Loussaert Michael E | $290,000 | Attorney | |
| Decker Todd M | $260,000 | None Available | |
| Tobin Brian J | $150,000 | None Available |
Source: Public Records
Mortgage History
| Date | Status | Borrower | Loan Amount |
|---|---|---|---|
| Previous Owner | Loussaert Michael E | $175,000 | |
| Previous Owner | Decker Todd M | $150,000 |
Source: Public Records
Tax History
| Year | Tax Paid | Tax Assessment Tax Assessment Total Assessment is a certain percentage of the fair market value that is determined by local assessors to be the total taxable value of land and additions on the property. | Land | Improvement |
|---|---|---|---|---|
| 2025 | $5,442 | $482,200 | $77,000 | $405,200 |
| 2024 | $5,300 | $434,700 | $53,300 | $381,400 |
| 2023 | $5,020 | $434,700 | $53,300 | $381,400 |
| 2022 | $4,864 | $354,050 | $46,950 | $307,100 |
| 2021 | $4,864 | $354,050 | $46,950 | $307,100 |
| 2020 | $4,868 | $346,800 | $46,950 | $299,850 |
| 2019 | $4,958 | $338,260 | $38,410 | $299,850 |
| 2018 | $5,006 | $338,260 | $38,410 | $299,850 |
| 2017 | $3,848 | $334,720 | $38,410 | $296,310 |
| 2016 | $3,894 | $252,320 | $0 | $0 |
| 2015 | $3,894 | $241,630 | $0 | $0 |
| 2014 | $3,792 | $241,630 | $0 | $0 |
| 2013 | $3,726 | $0 | $0 | $0 |
| 2012 | -- | $243,720 | $38,410 | $205,310 |
Source: Public Records
Map
Nearby Homes
- 1016 W Scott St
- 910 W Scott St
- 803 Dammann Dr
- 1003 W Scott St
- 921 W Scott St
- 1011 W Scott St
- 909 W Scott St
- 818 W Scott St
- 1019 W Scott St
- 821 W Scott St
- 950 W Maple Ct
- 1104 W Scott Ct
- 900 W Maple Ct
- 1000 W Maple Ct
- 850 W Maple Ct
- 1050 W Maple Ct
- 811 W Scott St
- 1101 W Scott Ct
- 1112 Scott St
- 1112 W Scott Ct
Your Personal Tour Guide
Ask me questions while you tour the home.