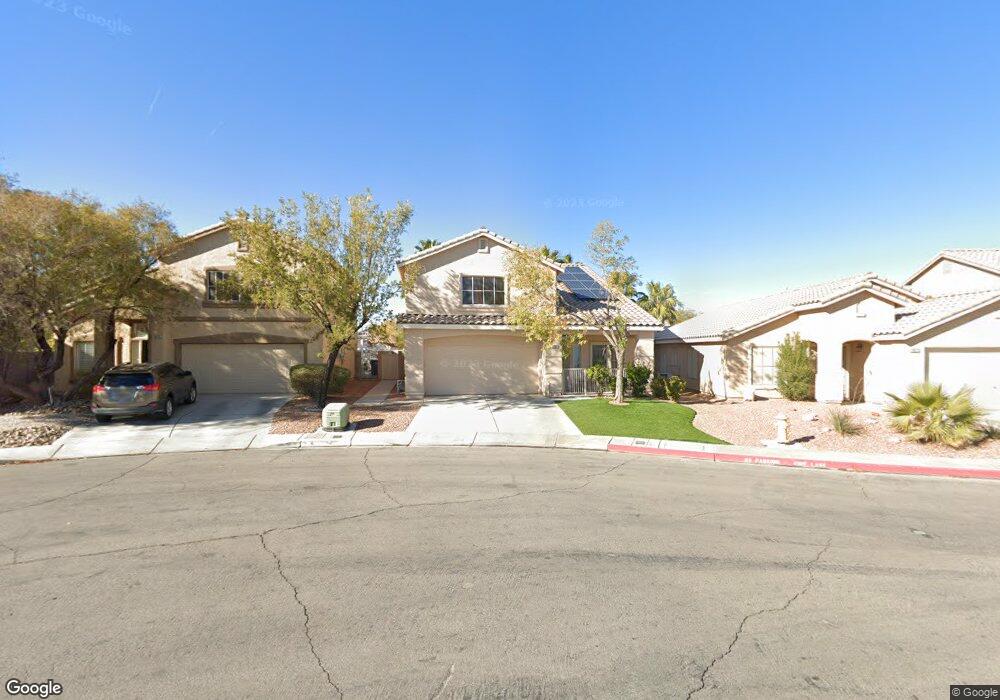
10083 Solid Lime St Las Vegas, NV 89183
Silverado Ranch NeighborhoodEstimated Value: $464,000 - $498,000
4
Beds
3
Baths
1,881
Sq Ft
$255/Sq Ft
Est. Value
About This Home
This home is located at 10083 Solid Lime St, Las Vegas, NV 89183 and is currently estimated at $479,330, approximately $254 per square foot. 10083 Solid Lime St is a home located in Clark County with nearby schools including John R. Hummel Elementary School, Charles Silvestri Junior High School, and Liberty High School.
Ownership History
Date
Name
Owned For
Owner Type
Purchase Details
Closed on
Dec 21, 2006
Sold by
Lincoln Emelin D and Lincoln Charles J
Bought by
Lincoln Emelin D and Lincoln Charles J
Current Estimated Value
Purchase Details
Closed on
Jun 25, 2003
Sold by
Lincoln Charles J and Lincoln Emelin
Bought by
Lincoln Charles J and Lincoln Emelin
Home Financials for this Owner
Home Financials are based on the most recent Mortgage that was taken out on this home.
Original Mortgage
$133,500
Interest Rate
5.26%
Mortgage Type
Unknown
Purchase Details
Closed on
Aug 18, 1999
Sold by
Emerald Ridge Llc
Bought by
Lincoln Charles J and Lincoln Emelin
Home Financials for this Owner
Home Financials are based on the most recent Mortgage that was taken out on this home.
Original Mortgage
$148,189
Interest Rate
7.63%
Mortgage Type
VA
Create a Home Valuation Report for This Property
The Home Valuation Report is an in-depth analysis detailing your home's value as well as a comparison with similar homes in the area
Home Values in the Area
Average Home Value in this Area
Purchase History
| Date | Buyer | Sale Price | Title Company |
|---|---|---|---|
| Lincoln Emelin D | -- | None Available | |
| Lincoln Charles J | -- | Nevada Title Company | |
| Lincoln Charles J | $145,500 | United Title |
Source: Public Records
Mortgage History
| Date | Status | Borrower | Loan Amount |
|---|---|---|---|
| Closed | Lincoln Charles J | $133,500 | |
| Closed | Lincoln Charles J | $148,189 |
Source: Public Records
Tax History
| Year | Tax Paid | Tax Assessment Tax Assessment Total Assessment is a certain percentage of the fair market value that is determined by local assessors to be the total taxable value of land and additions on the property. | Land | Improvement |
|---|---|---|---|---|
| 2026 | $2,119 | $125,073 | $42,000 | $83,073 |
| 2025 | $2,057 | $125,879 | $40,600 | $85,279 |
| 2024 | $1,997 | $125,879 | $40,600 | $85,279 |
| 2023 | $1,997 | $112,166 | $31,850 | $80,316 |
| 2022 | $1,944 | $99,679 | $25,900 | $73,779 |
| 2021 | $1,890 | $94,626 | $24,500 | $70,126 |
| 2020 | $1,830 | $94,021 | $24,500 | $69,521 |
| 2019 | $1,777 | $89,121 | $20,650 | $68,471 |
| 2018 | $1,726 | $83,307 | $17,500 | $65,807 |
| 2017 | $2,344 | $82,549 | $15,750 | $66,799 |
| 2016 | $1,633 | $78,733 | $11,900 | $66,833 |
| 2015 | $1,706 | $58,169 | $9,800 | $48,369 |
| 2014 | $1,582 | $54,780 | $7,000 | $47,780 |
Source: Public Records
Map
Nearby Homes
- 519 Salzburg Ave
- 10154 Coffeeberry Ct
- 10000 Clear Crystal St
- 10142 Rice Paper St
- 10187 Tree Bark St
- 735 Elliot Peak Ave
- 10195 Tree Bark St
- 9852 Altadena St
- 10016 Mystic Dance St
- 829 Dancing Vines Ave
- 426 Roman Tree Ct
- 9861 Del Mar Heights St
- 9801 Bradford Summit St
- 10257 Philmont Ct
- 10294 Bethel Mill St
- 439 Dairy Creek Ave
- 742 Canfield Point Ave
- 9828 Gold Pan Ct
- 555 E Silverado Ranch Blvd Unit 1123
- 555 E Silverado Ranch Blvd Unit 1024
- 10073 Solid Lime St
- 10093 Solid Lime St
- 10080 Victorian Lace St
- 10063 Solid Lime St
- 623 Sole Addiction Ave
- 623 Sole Addiction Ave Unit n/a
- 10070 Victorian Lace St
- 10090 Victorian Lace St
- 10053 Solid Lime St
- 629 Sole Addiction Ave
- 10074 Solid Lime St
- 10060 Victorian Lace St
- 10064 Solid Lime St
- 635 Sole Addiction Ave
- 10043 Solid Lime St
- 585 Green Gables Ave
- 10054 Solid Lime St
- 641 Sole Addiction Ave
- 10050 Victorian Lace St
- 10033 Solid Lime St
Your Personal Tour Guide
Ask me questions while you tour the home.