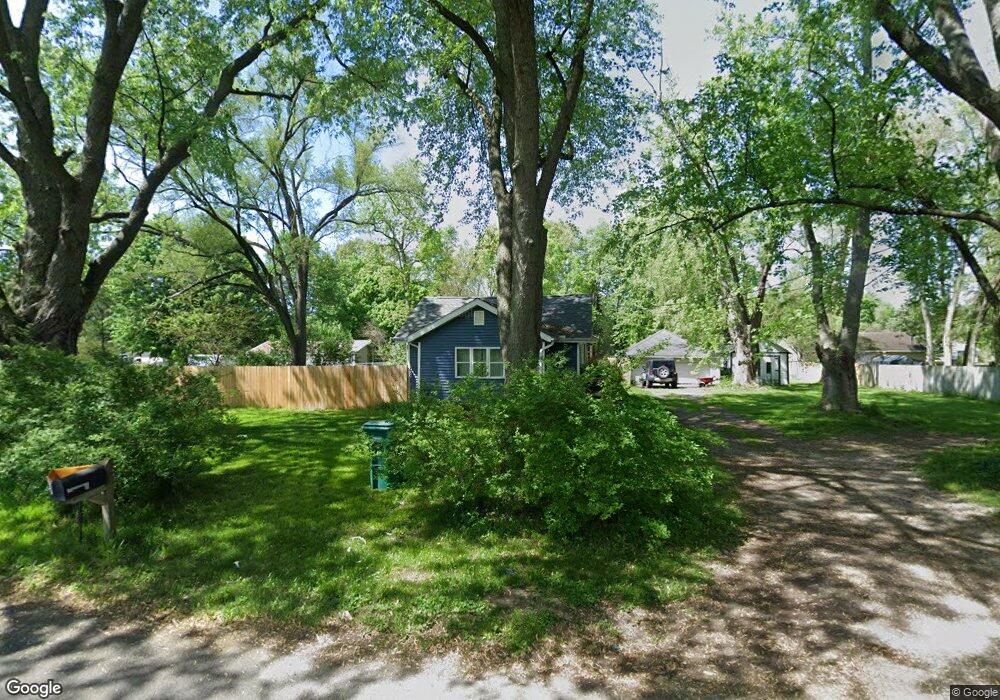
10085 Henry Rd Osceola, IN 46561
Estimated Value: $222,000 - $256,000
3
Beds
1
Bath
1,012
Sq Ft
$233/Sq Ft
Est. Value
About This Home
This home is located at 10085 Henry Rd, Osceola, IN 46561 and is currently estimated at $235,843, approximately $233 per square foot. 10085 Henry Rd is a home located in St. Joseph County with nearby schools including Elm Road Elementary School, Virgil I. Grissom Middle School, and Penn High School.
Ownership History
Date
Name
Owned For
Owner Type
Purchase Details
Closed on
Aug 26, 2025
Sold by
Learman Jonathan B
Bought by
Learman Brody M
Current Estimated Value
Home Financials for this Owner
Home Financials are based on the most recent Mortgage that was taken out on this home.
Original Mortgage
$120,000
Outstanding Balance
$120,000
Interest Rate
6.75%
Mortgage Type
New Conventional
Estimated Equity
$115,843
Purchase Details
Closed on
Jun 11, 2024
Sold by
Learman Joshua John
Bought by
Learman Jonathan B
Purchase Details
Closed on
Dec 21, 2017
Sold by
Wells Fargo Bank
Bought by
Learman Joshua John
Purchase Details
Closed on
Nov 17, 2016
Sold by
St Joseph County Sheriff
Bought by
Wells Fargo Bank
Purchase Details
Closed on
May 13, 2015
Sold by
Jacks Kelly
Bought by
Bright Rick
Purchase Details
Closed on
Apr 4, 2008
Sold by
King Bonnie Jo
Bought by
Bright Rick T and Jacks Kelly L
Home Financials for this Owner
Home Financials are based on the most recent Mortgage that was taken out on this home.
Original Mortgage
$83,751
Interest Rate
6.32%
Mortgage Type
FHA
Purchase Details
Closed on
Jun 23, 2005
Sold by
King Terry Dean
Bought by
King Bonnie Jo
Create a Home Valuation Report for This Property
The Home Valuation Report is an in-depth analysis detailing your home's value as well as a comparison with similar homes in the area
Home Values in the Area
Average Home Value in this Area
Purchase History
| Date | Buyer | Sale Price | Title Company |
|---|---|---|---|
| Learman Brody M | -- | Meridian Title | |
| Learman Jonathan B | -- | None Listed On Document | |
| Learman Joshua John | $52,500 | -- | |
| Wells Fargo Bank | $80,040 | -- | |
| Bright Rick | -- | -- | |
| Bright Rick T | -- | Hold For Meridian Title Crop | |
| King Bonnie Jo | -- | None Available |
Source: Public Records
Mortgage History
| Date | Status | Borrower | Loan Amount |
|---|---|---|---|
| Open | Learman Brody M | $120,000 | |
| Previous Owner | Bright Rick T | $83,751 |
Source: Public Records
Tax History Compared to Growth
Tax History
| Year | Tax Paid | Tax Assessment Tax Assessment Total Assessment is a certain percentage of the fair market value that is determined by local assessors to be the total taxable value of land and additions on the property. | Land | Improvement |
|---|---|---|---|---|
| 2024 | $5,735 | $197,200 | $57,000 | $140,200 |
| 2023 | $3,669 | $202,200 | $57,000 | $145,200 |
| 2022 | $3,669 | $202,200 | $57,000 | $145,200 |
| 2021 | $2,538 | $126,500 | $22,300 | $104,200 |
| 2020 | $2,216 | $111,500 | $22,800 | $88,700 |
| 2019 | $2,142 | $104,400 | $23,100 | $81,300 |
| 2018 | $1,610 | $82,700 | $19,700 | $63,000 |
| 2017 | $1,643 | $81,800 | $19,700 | $62,100 |
| 2016 | $435 | $81,800 | $19,700 | $62,100 |
| 2014 | $420 | $80,600 | $19,700 | $60,900 |
| 2013 | $347 | $68,400 | $16,700 | $51,700 |
Source: Public Records
Map
Nearby Homes
- 10076 Heather Lake Dr
- 58155 Beehler Rd
- 30228 County Road 22
- 30474 Jaxon Dr
- 310 E Adams St
- 30077 Oriole St
- 11211 Idlewood Dr
- 11249 Hemlock Dr
- 307 E Goshen Rd
- 502 W Adams St
- 603 W Adams St
- 414 W Superior St
- 418 W Superior St
- 59412 County Road 1
- 29591 County Road 22
- 56934 Ash Rd
- 301 N Olive St
- 30468 Tower Rd
- 29491 County Road 22
- 11024 Bayou Ct Unit 276
- 10105 Henry Rd
- 58477 Ash Rd
- 10041 Heather Brooke Dr
- 10061 Heather Brooke Dr
- 58470 Beehler Rd
- 58447 Ash Rd
- 10081 Heather Brooke Dr
- 10021 Heather Brooke Dr
- 10103 Heather Brooke Dr
- 58430 Beehler Rd
- 58441 Ash Rd
- 58568 Hidden Springs Dr
- 58390 Ash Rd
- 10123 Heather Brooke Dr
- 10062 Heather Brooke Dr
- 10147 Henry Rd
- 30981 Byrkit Dr
- 58575 Hidden Springs Dr
- 58451 Beehler Rd
- 10082 Heather Brooke Dr