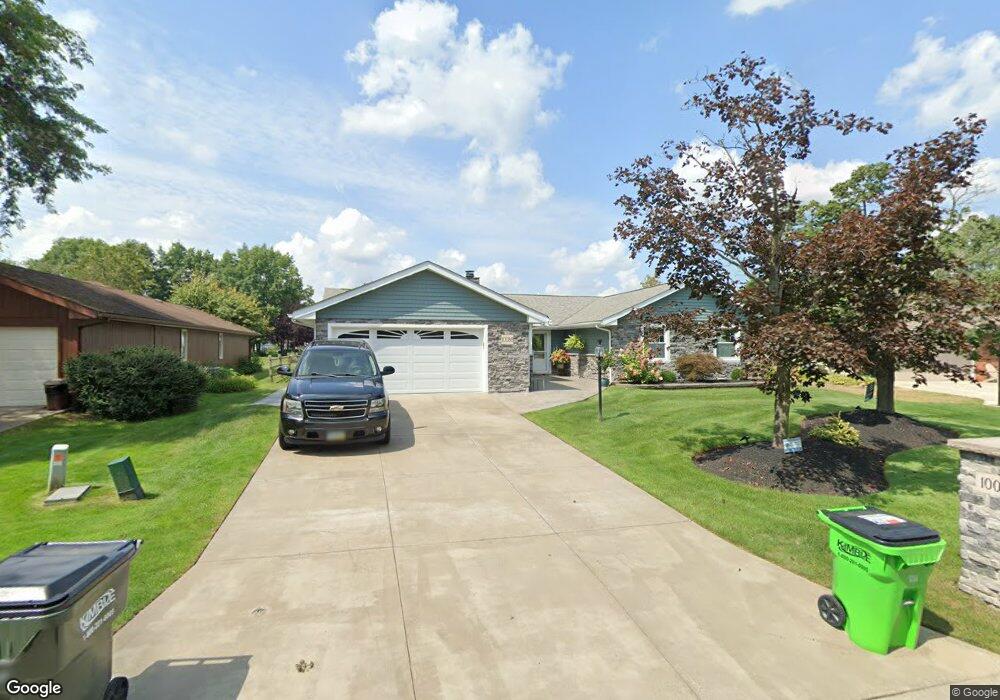
10088 Crows Nest Cove Aurora, OH 44202
Estimated Value: $360,837 - $409,000
4
Beds
2
Baths
1,824
Sq Ft
$216/Sq Ft
Est. Value
About This Home
This home is located at 10088 Crows Nest Cove, Aurora, OH 44202 and is currently estimated at $394,709, approximately $216 per square foot. 10088 Crows Nest Cove is a home located in Summit County with nearby schools including Wilcox Primary School, Samuel Bissell Elementary School, and Dodge Intermediate School.
Ownership History
Date
Name
Owned For
Owner Type
Purchase Details
Closed on
Oct 9, 1998
Sold by
Herrington Garry and Herrington Monica
Bought by
Herrington Garry W
Current Estimated Value
Home Financials for this Owner
Home Financials are based on the most recent Mortgage that was taken out on this home.
Original Mortgage
$135,000
Interest Rate
6.9%
Purchase Details
Closed on
May 15, 1995
Sold by
Caroso Robert R
Bought by
Herrington Garry and Herrington Monica
Home Financials for this Owner
Home Financials are based on the most recent Mortgage that was taken out on this home.
Original Mortgage
$131,200
Interest Rate
8.13%
Mortgage Type
New Conventional
Create a Home Valuation Report for This Property
The Home Valuation Report is an in-depth analysis detailing your home's value as well as a comparison with similar homes in the area
Home Values in the Area
Average Home Value in this Area
Purchase History
| Date | Buyer | Sale Price | Title Company |
|---|---|---|---|
| Herrington Garry W | -- | Prospect Title Agency Inc | |
| Herrington Garry | $164,000 | -- |
Source: Public Records
Mortgage History
| Date | Status | Borrower | Loan Amount |
|---|---|---|---|
| Closed | Herrington Garry W | $135,000 | |
| Closed | Herrington Garry | $131,200 |
Source: Public Records
Tax History Compared to Growth
Tax History
| Year | Tax Paid | Tax Assessment Tax Assessment Total Assessment is a certain percentage of the fair market value that is determined by local assessors to be the total taxable value of land and additions on the property. | Land | Improvement |
|---|---|---|---|---|
| 2025 | $5,577 | $110,240 | $19,443 | $90,797 |
| 2024 | $5,577 | $110,240 | $19,443 | $90,797 |
| 2023 | $5,577 | $110,240 | $19,443 | $90,797 |
| 2022 | $5,172 | $91,935 | $16,202 | $75,733 |
| 2021 | $5,196 | $91,935 | $16,202 | $75,733 |
| 2020 | $5,258 | $91,930 | $16,200 | $75,730 |
| 2019 | $4,874 | $79,310 | $15,860 | $63,450 |
| 2018 | $4,785 | $79,310 | $15,860 | $63,450 |
| 2017 | $3,960 | $79,310 | $15,860 | $63,450 |
| 2016 | $3,937 | $69,630 | $15,860 | $53,770 |
| 2015 | $3,960 | $69,630 | $15,860 | $53,770 |
| 2014 | $3,949 | $69,630 | $15,860 | $53,770 |
| 2013 | $3,423 | $60,170 | $14,330 | $45,840 |
Source: Public Records
Map
Nearby Homes
- 3624 Nautilus Trail
- 3522 Castaway Cove
- 10269 Smugglers Cove
- 3660 Ivy Ct
- 3784 Firethorn Dr
- 10265 Beaver Trail
- 3336 Blossom Trail
- 1174 Bryce Ave
- 915 Cimarron Oval
- 1085 Orchard Ave
- 3331 Shale Dr
- 676 Nancy Dr
- 1101 Lake Ave
- 1040 Moneta Ave
- SL Moneta Ave
- 3209 Fenmore Ln
- 3082 Willowbrook Dr
- 777 Nancy Dr
- 794 Robinhood Dr
- 10358 Townley Ct
- 10080 Crows Nest Cove
- 10096 Crows Nest Cove
- 10111 Regatta Trail
- 10072 Crows Nest Cove
- 10104 Crows Nest Cove
- 10115 Regatta Trail
- 10107 Regatta Trail
- 10064 Crows Nest Cove
- 10083 Crows Nest Cove
- 10103 Regatta Trail
- 10112 Crows Nest Cove
- 10119 Regatta Trail
- 10073 Crows Nest Cove
- 10095 Regatta Trail
- 10065 Crows Nest Cove
- 10056 Crows Nest Cove
- 10121 Crows Nest Cove
- 3704 Nautilus Trail
- 10120 Crows Nest Cove
- 10123 Regatta Trail