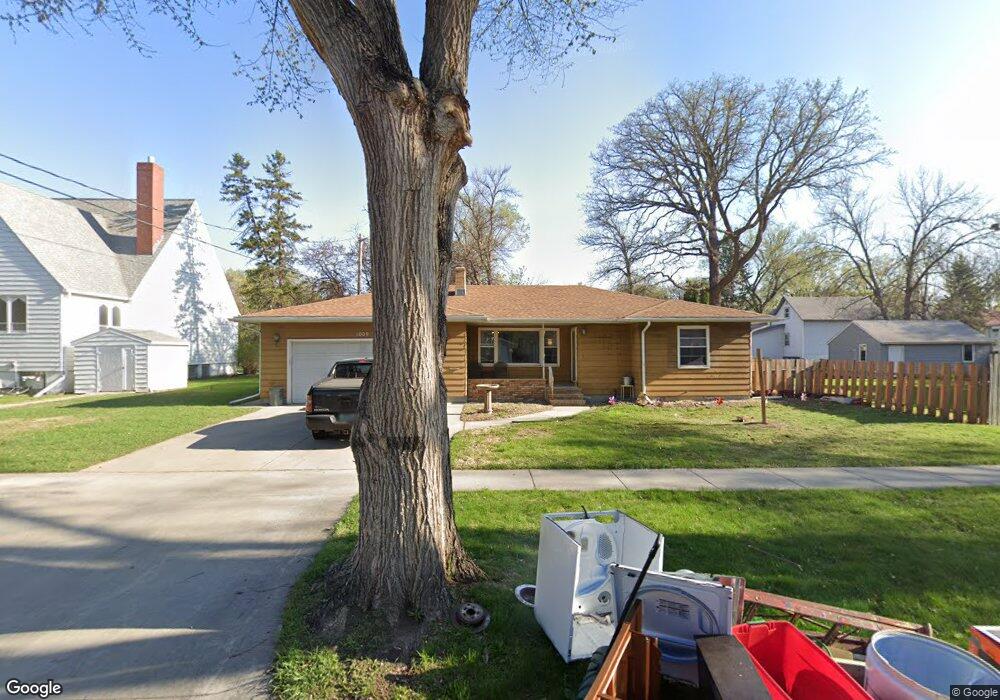
1009 12th Ave S Fargo, ND 58103
Hawthorne NeighborhoodEstimated Value: $246,000 - $341,000
2
Beds
2
Baths
2,893
Sq Ft
$99/Sq Ft
Est. Value
About This Home
This home is located at 1009 12th Ave S, Fargo, ND 58103 and is currently estimated at $287,313, approximately $99 per square foot. 1009 12th Ave S is a home located in Cass County with nearby schools including Clara Barton Elementary School, Ben Franklin Middle School, and South High School.
Ownership History
Date
Name
Owned For
Owner Type
Purchase Details
Closed on
Dec 9, 2020
Sold by
Siekaniec Thomas and Siekaniec Revocable Living Tru
Bought by
Thorsgaard Michelle R and Thorsgaard Theodore Z
Current Estimated Value
Home Financials for this Owner
Home Financials are based on the most recent Mortgage that was taken out on this home.
Original Mortgage
$190,120
Outstanding Balance
$169,565
Interest Rate
2.8%
Mortgage Type
New Conventional
Estimated Equity
$117,748
Purchase Details
Closed on
Jan 30, 2020
Sold by
Siekaniec Diane Kay
Bought by
Siekaniec Diane Kay and Siekaniec Revocable Living Tru
Purchase Details
Closed on
Oct 24, 2012
Sold by
Peterson Lola J and The Robert D And Lola J Peters
Bought by
Siekaniec Diane K
Home Financials for this Owner
Home Financials are based on the most recent Mortgage that was taken out on this home.
Original Mortgage
$129,600
Interest Rate
3.51%
Mortgage Type
New Conventional
Create a Home Valuation Report for This Property
The Home Valuation Report is an in-depth analysis detailing your home's value as well as a comparison with similar homes in the area
Home Values in the Area
Average Home Value in this Area
Purchase History
| Date | Buyer | Sale Price | Title Company |
|---|---|---|---|
| Thorsgaard Michelle R | $196,000 | The Title Co | |
| Siekaniec Diane Kay | -- | None Available | |
| Siekaniec Diane K | $162,000 | None Available |
Source: Public Records
Mortgage History
| Date | Status | Borrower | Loan Amount |
|---|---|---|---|
| Open | Thorsgaard Michelle R | $190,120 | |
| Previous Owner | Siekaniec Diane K | $129,600 |
Source: Public Records
Tax History
| Year | Tax Paid | Tax Assessment Tax Assessment Total Assessment is a certain percentage of the fair market value that is determined by local assessors to be the total taxable value of land and additions on the property. | Land | Improvement |
|---|---|---|---|---|
| 2024 | $3,839 | $132,500 | $29,050 | $103,450 |
| 2023 | $4,146 | $125,000 | $29,050 | $95,950 |
| 2022 | $4,065 | $119,050 | $29,050 | $90,000 |
| 2021 | $3,811 | $110,750 | $29,050 | $81,700 |
| 2020 | $3,798 | $110,750 | $29,050 | $81,700 |
| 2019 | $3,638 | $103,600 | $16,150 | $87,450 |
| 2018 | $3,628 | $103,600 | $16,150 | $87,450 |
| 2017 | $3,548 | $100,600 | $16,150 | $84,450 |
| 2016 | $3,289 | $97,650 | $16,150 | $81,500 |
| 2015 | $3,523 | $99,850 | $12,100 | $87,750 |
| 2014 | $3,422 | $92,450 | $12,100 | $80,350 |
| 2013 | $3,336 | $88,050 | $12,100 | $75,950 |
Source: Public Records
Map
Nearby Homes
- 1301 10th St S
- 1112 University Dr S
- 911 8th St S
- 817 9th St S
- 820 10th St S Unit C20
- 804 10th St S Unit A4
- 1011 14th St S
- 1425 11th St S
- 1439 10th St S
- 601 10th St S
- 1422 8th Ave S
- 1502 8th St S
- 1410 14 1 2 St S
- 1416 14 1 2 St S
- 605 7th St S Unit 2
- 505 8th St S
- 502 8th St S Unit 5
- 502 8th St S Unit 1
- 502 8th St S Unit 2
- 502 8th St S Unit 4
- 1111 10th St S
- 1105 10th St S
- 1103 10th St S
- 1014 12th Ave S
- 1018 12th Ave S
- 1102 11th St S
- 1101 10th St S
- 1020 12th Ave S
- 1209 10th St S
- 1022 11th Ave S
- 1210 11th St S
- 1213 10th St S
- 1122 10th St S
- 1124 10th St S
- 1114 10th St S
- 1214 11th St S
- 1119 11th St S
- 1123 11th St S
- 1117 11th St S
- 1106 10th St S
Your Personal Tour Guide
Ask me questions while you tour the home.