T
Seller's Agent in 2025
Trae Hobson
Massad Real Estate
(507) 327-0337
1 in this area
10 Total Sales
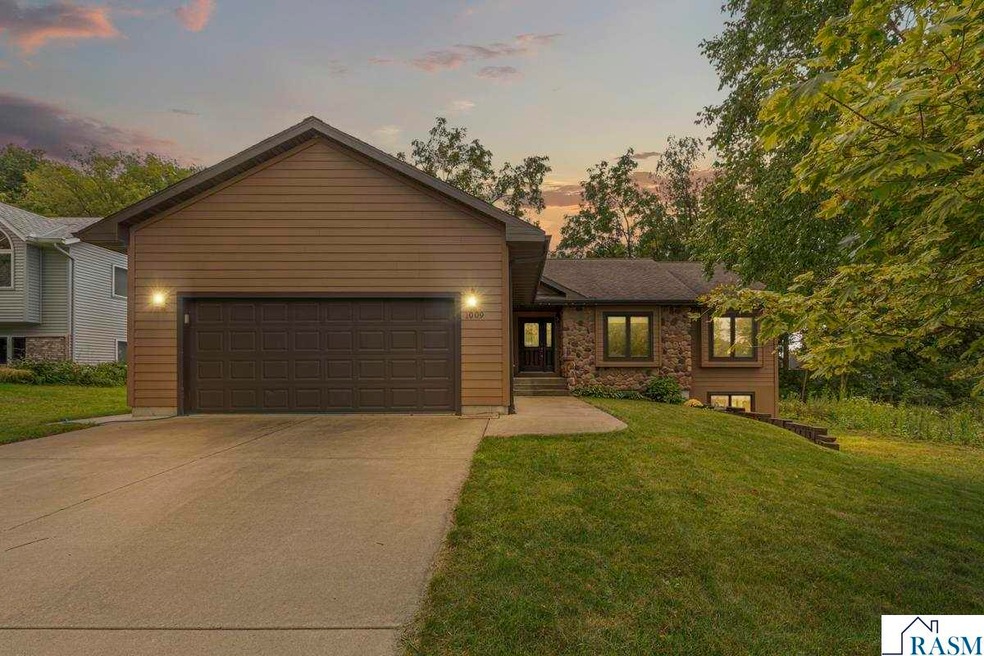


With over 3,300 square feet of living space, this 3-bedroom, 3-bathroom home was thoughtfully designed and built in 2007 by its original owners as a place of comfort and care. Enter inside to a bright, vaulted great room where a striking stone-accented south wall and an abundance of windows create a warm, open feel. The adaptable floor plan flows naturally into the dining area and kitchen, complete with hickory cabinetry, a glass display cupboard, and plenty of storage to keep everything organized. All three bedrooms are conveniently located on the main level, including a spacious primary suite with a walk-in shower, relaxing jetted tub, and generous closet space. Main-floor laundry adds everyday ease. The lower level expands your possibilities with tall ceilings, a full bathroom, stained concrete floors, and a partially finished layout ready for your vision. Whether you keep part of it as a workshop, recreation space, or custom retreat, the basement offers room to grow. Outdoors, enjoy the deck overlooking the quarter-acre lot, perfect for morning coffee or evening gatherings. Additional highlights include central air installed in 2024 and a heated, insulated garage. Nestled near River Bend Nature Center and within walking distance to the hospital, this home offers the perfect blend of space, convenience, and location.
Last Agent to Sell the Property
Massad Real Estate Brokerage Email: info@massadrealestate.com License #40919631 Listed on: 09/10/2025
Co-Listed By
Massad Real Estate Brokerage Email: info@massadrealestate.com License #40487187
Last Buyer's Agent
Non Member
Non-Member
| Date | Type | Sale Price | Title Company |
|---|---|---|---|
| Warranty Deed | $364,600 | Precision Land Title | |
| Deed | -- | None Listed On Document | |
| Contract Of Sale | $47,900 | -- |
| Date | Status | Loan Amount | Loan Type |
|---|---|---|---|
| Open | $353,662 | New Conventional | |
| Closed | $12,100 | New Conventional |
| Date | Event | Price | List to Sale | Price per Sq Ft |
|---|---|---|---|---|
| 10/24/2025 10/24/25 | Sold | $366,700 | +3.3% | $148 / Sq Ft |
| 09/21/2025 09/21/25 | Pending | -- | -- | -- |
| 09/17/2025 09/17/25 | For Sale | $355,000 | -3.2% | $143 / Sq Ft |
| 09/10/2025 09/10/25 | Off Market | $366,700 | -- | -- |
| Year | Tax Paid | Tax Assessment Tax Assessment Total Assessment is a certain percentage of the fair market value that is determined by local assessors to be the total taxable value of land and additions on the property. | Land | Improvement |
|---|---|---|---|---|
| 2025 | $4,098 | $365,100 | $60,200 | $304,900 |
| 2024 | $4,098 | $368,100 | $56,600 | $311,500 |
| 2023 | $3,766 | $368,100 | $56,600 | $311,500 |
| 2022 | $3,354 | $316,100 | $51,100 | $265,000 |
| 2021 | $3,264 | $267,300 | $38,300 | $229,000 |
| 2020 | $2,686 | $259,600 | $38,300 | $221,300 |
| 2019 | $2,466 | $222,000 | $38,300 | $183,700 |
| 2018 | $2,446 | $203,700 | $32,900 | $170,800 |
| 2017 | $2,444 | $197,800 | $31,000 | $166,800 |
| 2016 | $2,402 | $192,100 | $29,200 | $162,900 |
| 2015 | $2,310 | $185,700 | $29,200 | $156,500 |
| 2014 | -- | $187,300 | $29,200 | $158,100 |
T
Seller's Agent in 2025
Trae Hobson
Massad Real Estate
(507) 327-0337
1 in this area
10 Total Sales

Seller Co-Listing Agent in 2025
George Jorgenson-Massad
Massad Real Estate
(507) 469-5093
1 in this area
158 Total Sales
N
Buyer's Agent in 2025
Non Member
Non-Member
Source: REALTOR® Association of Southern Minnesota
MLS Number: 7038535
APN: 18.32.4.28.053
Disclaimer: Certain information contained herein is derived from information provided by parties other than Homes.com. All information provided is deemed reliable, but is not guaranteed to be accurate and should be independently verified.
![]() IDX information is provided exclusively for personal, non-commercial use, and may not be used for any purpose other than to identify prospective properties consumers may be interested in purchasing. Information is deemed reliable but not guaranteed.
IDX information is provided exclusively for personal, non-commercial use, and may not be used for any purpose other than to identify prospective properties consumers may be interested in purchasing. Information is deemed reliable but not guaranteed.
Ask me questions while you tour the home.