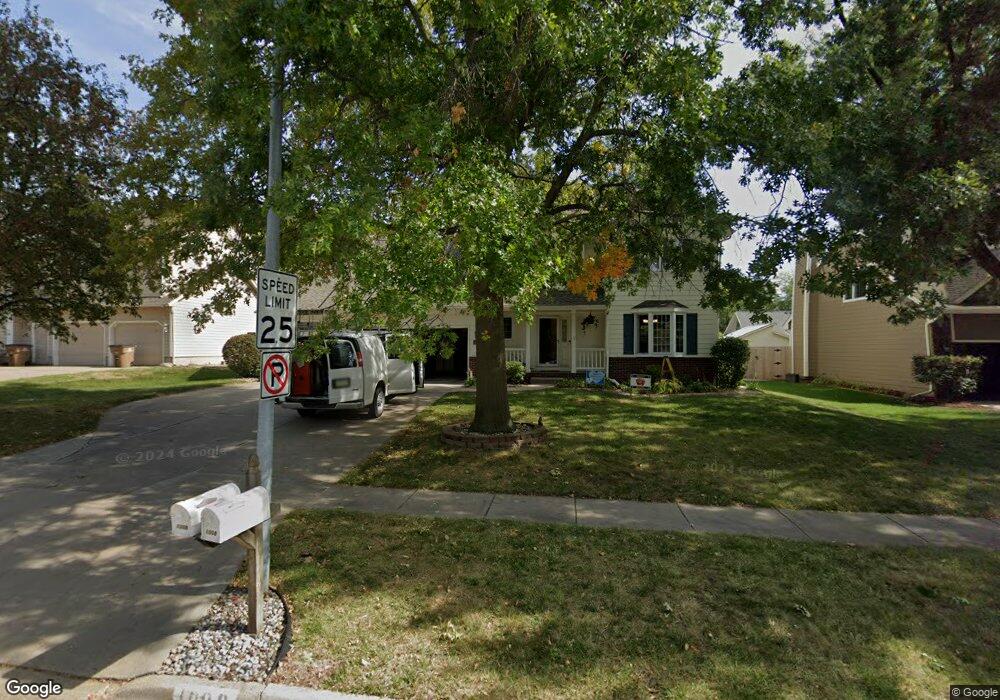
1009 57th St West Des Moines, IA 50266
Estimated Value: $374,000 - $415,000
4
Beds
3
Baths
2,118
Sq Ft
$184/Sq Ft
Est. Value
About This Home
This home is located at 1009 57th St, West Des Moines, IA 50266 and is currently estimated at $390,307, approximately $184 per square foot. 1009 57th St is a home located in Polk County with nearby schools including Westridge Elementary School, Valley Southwoods Freshman High School, and Indian Hills Junior High School.
Ownership History
Date
Name
Owned For
Owner Type
Purchase Details
Closed on
Feb 3, 2005
Sold by
Zierke Chad and Zierke Jodi L
Bought by
Lerg Brian and Roettger Lerg Ruth M
Current Estimated Value
Home Financials for this Owner
Home Financials are based on the most recent Mortgage that was taken out on this home.
Original Mortgage
$244,036
Outstanding Balance
$123,454
Interest Rate
5.78%
Mortgage Type
VA
Estimated Equity
$266,853
Purchase Details
Closed on
Aug 14, 2003
Sold by
Gratias Jeffrey G and Collins Gratias Kathleen A
Bought by
Zierke Chad and Zierke Jodi L
Home Financials for this Owner
Home Financials are based on the most recent Mortgage that was taken out on this home.
Original Mortgage
$183,920
Interest Rate
4.62%
Mortgage Type
Purchase Money Mortgage
Create a Home Valuation Report for This Property
The Home Valuation Report is an in-depth analysis detailing your home's value as well as a comparison with similar homes in the area
Home Values in the Area
Average Home Value in this Area
Purchase History
| Date | Buyer | Sale Price | Title Company |
|---|---|---|---|
| Lerg Brian | $238,500 | -- | |
| Zierke Chad | $229,500 | -- |
Source: Public Records
Mortgage History
| Date | Status | Borrower | Loan Amount |
|---|---|---|---|
| Open | Lerg Brian | $244,036 | |
| Previous Owner | Zierke Chad | $183,920 | |
| Closed | Zierke Chad | $45,980 |
Source: Public Records
Tax History Compared to Growth
Tax History
| Year | Tax Paid | Tax Assessment Tax Assessment Total Assessment is a certain percentage of the fair market value that is determined by local assessors to be the total taxable value of land and additions on the property. | Land | Improvement |
|---|---|---|---|---|
| 2025 | $4,340 | $343,400 | $68,600 | $274,800 |
| 2024 | $4,340 | $301,500 | $59,300 | $242,200 |
| 2023 | $4,626 | $301,500 | $59,300 | $242,200 |
| 2022 | $4,568 | $255,200 | $51,700 | $203,500 |
| 2021 | $4,874 | $255,200 | $51,700 | $203,500 |
| 2020 | $4,794 | $258,200 | $52,300 | $205,900 |
| 2019 | $4,530 | $258,200 | $52,300 | $205,900 |
| 2018 | $4,534 | $236,200 | $46,500 | $189,700 |
| 2017 | $4,370 | $236,200 | $46,500 | $189,700 |
| 2016 | $4,268 | $221,800 | $42,800 | $179,000 |
| 2015 | $4,268 | $221,800 | $42,800 | $179,000 |
| 2014 | $3,896 | $207,800 | $39,400 | $168,400 |
Source: Public Records
Map
Nearby Homes
- 5808 Center St
- 6140 Ashworth Rd
- 6140 Woodland Dr
- 702 58th St
- 1109 62nd St
- 1122 62nd St
- 6216 Orchard Dr
- 1032 Bradford Place
- 1067 Bradford Place
- 6178 Aspen Dr
- 1041 Bradford Place
- 6128 Acadia Dr
- 5317 Pommel Place
- 989 65th St
- 681 63rd St
- 980 65th St
- 935 66th St
- 608 53rd St
- 724 Knolls Ct
- 5925 Ep True Pkwy Unit 25