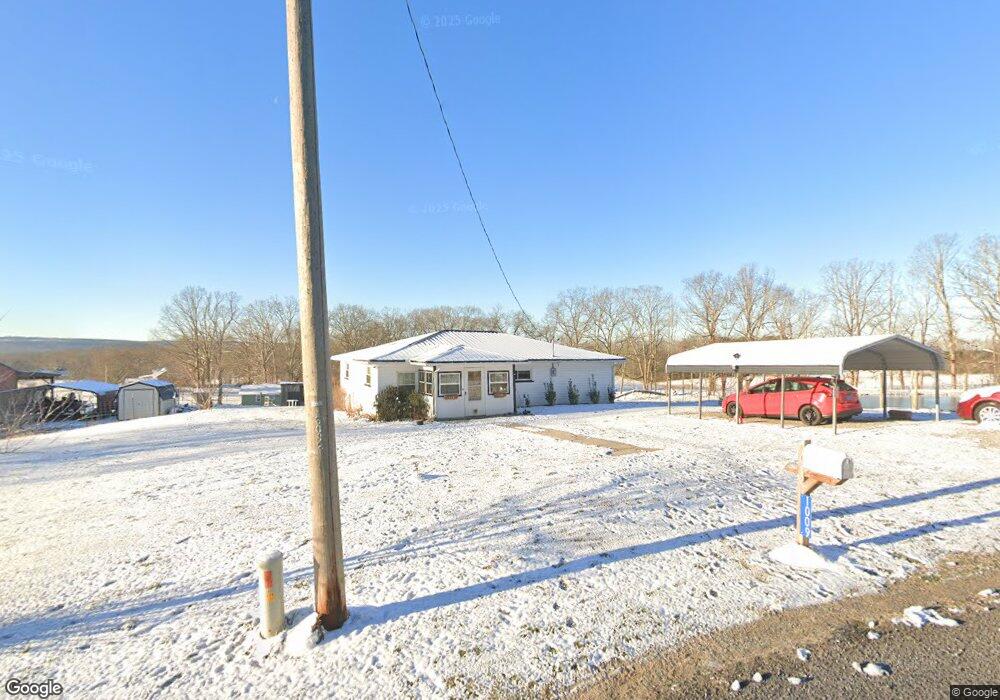
1009 Bennie Camp Rd Dunlap, TN 37327
Cagle-Fredonia NeighborhoodEstimated Value: $249,000
3
Beds
1
Bath
1,271
Sq Ft
$196/Sq Ft
Est. Value
About This Home
This home is located at 1009 Bennie Camp Rd, Dunlap, TN 37327 and is currently estimated at $249,000, approximately $195 per square foot. 1009 Bennie Camp Rd is a home located in Sequatchie County with nearby schools including Griffith Elementary School, Sequatchie County Middle School, and Sequatchie County High School.
Ownership History
Date
Name
Owned For
Owner Type
Purchase Details
Closed on
Sep 15, 2021
Sold by
Bizzell James and Bizzell Laurie
Bought by
Smith Kevin N and Thompson Jennifer
Current Estimated Value
Purchase Details
Closed on
Jun 23, 2021
Sold by
Mitchell John Raymond and Mitchell Susan
Bought by
Bizzell James and Bizzell Laurie
Home Financials for this Owner
Home Financials are based on the most recent Mortgage that was taken out on this home.
Original Mortgage
$170,943
Interest Rate
2.9%
Mortgage Type
Commercial
Purchase Details
Closed on
Aug 12, 2004
Sold by
Johnson Gregory K
Bought by
Ramsey James N
Purchase Details
Closed on
Jun 4, 2003
Sold by
Gregory Johnson
Bought by
Randy Bowman
Home Financials for this Owner
Home Financials are based on the most recent Mortgage that was taken out on this home.
Original Mortgage
$8,020
Interest Rate
5.56%
Purchase Details
Closed on
Sep 30, 2002
Sold by
Barker Johnson and Jo Betty
Bought by
Johnson Gregory K
Purchase Details
Closed on
Mar 8, 1991
Bought by
Johnson Barker and Johnson Wife Betty Joe
Purchase Details
Closed on
Feb 20, 1990
Bought by
Johnson Barker and Johnson Wife
Create a Home Valuation Report for This Property
The Home Valuation Report is an in-depth analysis detailing your home's value as well as a comparison with similar homes in the area
Home Values in the Area
Average Home Value in this Area
Purchase History
| Date | Buyer | Sale Price | Title Company |
|---|---|---|---|
| Smith Kevin N | $40,270 | None Available | |
| Bizzell James | $90,000 | None Available | |
| Ramsey James N | $310,275 | -- | |
| Randy Bowman | $69,020 | -- | |
| Johnson Gregory K | $400,000 | -- | |
| Johnson Barker | $2,200 | -- | |
| Johnson Barker | $3,600 | -- |
Source: Public Records
Mortgage History
| Date | Status | Borrower | Loan Amount |
|---|---|---|---|
| Previous Owner | Bizzell James | $170,943 | |
| Previous Owner | Johnson Barker | $8,020 |
Source: Public Records
Tax History
| Year | Tax Paid | Tax Assessment Tax Assessment Total Assessment is a certain percentage of the fair market value that is determined by local assessors to be the total taxable value of land and additions on the property. | Land | Improvement |
|---|---|---|---|---|
| 2025 | $213 | $11,600 | $11,600 | $0 |
| 2024 | $213 | $11,600 | $11,600 | $0 |
| 2023 | $213 | $11,600 | $11,600 | $0 |
| 2022 | $211 | $8,650 | $8,650 | $0 |
| 2021 | $814 | $8,025 | $8,025 | $0 |
| 2020 | $814 | $33,325 | $28,100 | $5,225 |
| 2019 | $814 | $33,325 | $28,100 | $5,225 |
| 2018 | $814 | $33,325 | $28,100 | $5,225 |
| 2017 | $858 | $35,125 | $28,100 | $7,025 |
| 2016 | $839 | $32,650 | $27,000 | $5,650 |
| 2015 | $837 | $32,600 | $27,000 | $5,600 |
| 2014 | $837 | $32,600 | $27,000 | $5,600 |
Source: Public Records
Map
Nearby Homes
- 1368 Bennie Camp Rd
- 0 Bennie Camp Rd Unit RTC3165688
- 0 Bennie Camp Rd Unit 1531492
- 408 Sherman Rd
- 1231 Black Mountain Rd
- 218 Black Mountain Rd W
- Lot 11 Green Forest Rd
- 0 S R 8
- 60 Laurel Ridge
- 11556 R 8
- 0 Woods Rd Unit RTC3042786
- 0 Woods Rd Unit 1523709
- 13 N Greenfields Way
- 13 Bear Wallow Rd
- Lot 13 Bear Wallow Rd
- Artillery Rd
- 0 Saddleback Rd Unit 1526682
- 4 Tennessee 399
- Lot 6 Longview Ridge
- 0 Fredonia Rd Unit 1240366
- 1009 Bennie Camp Rd
- 1025 Bennie Camp Rd
- 80 Leilani Ln
- 912 Bennie Camp Rd
- 120 Leilani Ln
- 120 Leilani Ln
- 1008 Bennie Camp Rd
- 160 Leilani Ln
- 117 Leilani Ln
- 85 Christian Rd
- 280 Leilani Ln
- 280 Leilani Ln
- 280 Leilani Ln Unit A
- 955 Bennie Camp Rd
- 61 Thompson Rd
- 1314 Bennie Camp Rd
- 139 Thompson Rd
- 170 Christian Rd
- 633 Bennie Camp Rd
- 634 Bennie Camp Rd
Your Personal Tour Guide
Ask me questions while you tour the home.