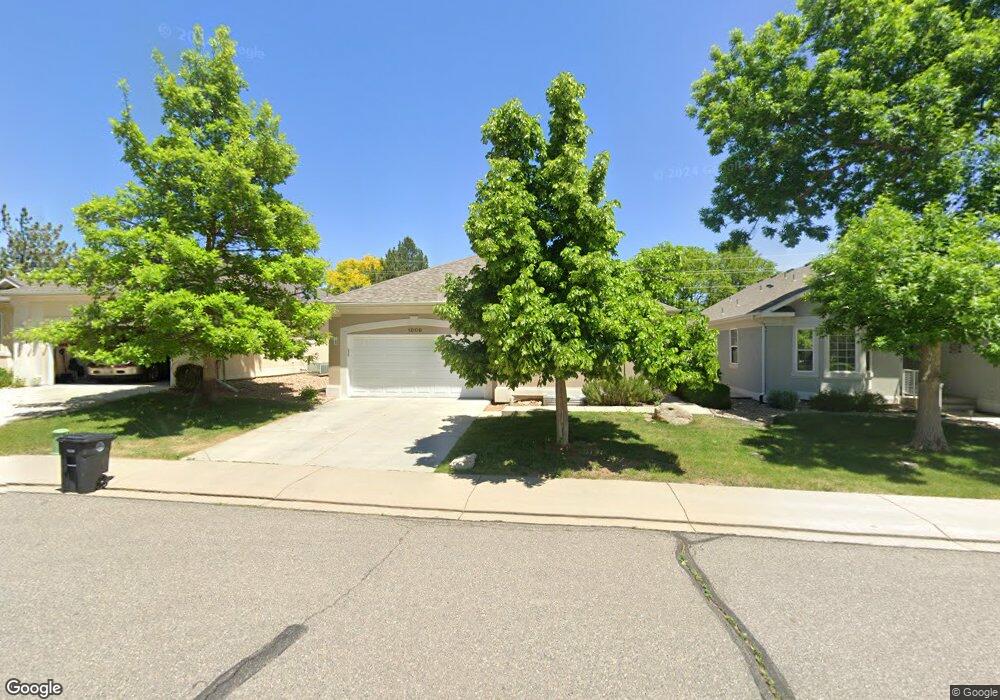
1009 Champion Cir Longmont, CO 80503
Longmont Estates NeighborhoodEstimated Value: $626,513 - $708,000
4
Beds
3
Baths
3,095
Sq Ft
$212/Sq Ft
Est. Value
About This Home
This home is located at 1009 Champion Cir, Longmont, CO 80503 and is currently estimated at $657,128, approximately $212 per square foot. 1009 Champion Cir is a home located in Boulder County with nearby schools including Longmont Estates Elementary School, Westview Middle School, and Silver Creek High School.
Ownership History
Date
Name
Owned For
Owner Type
Purchase Details
Closed on
Jun 18, 2015
Sold by
Spangler Joan V
Bought by
Mason Margaret Bartram
Current Estimated Value
Purchase Details
Closed on
Aug 6, 2010
Sold by
Wimer Kevin B and Wimer Sandra J
Bought by
Spangler Richard W
Purchase Details
Closed on
Oct 27, 1999
Sold by
J D Collins Construction Inc
Bought by
Wimer Kevin B
Home Financials for this Owner
Home Financials are based on the most recent Mortgage that was taken out on this home.
Original Mortgage
$202,196
Interest Rate
7.85%
Purchase Details
Closed on
Oct 14, 1999
Sold by
C G Development Llc
Bought by
J D Collins Construction Inc
Home Financials for this Owner
Home Financials are based on the most recent Mortgage that was taken out on this home.
Original Mortgage
$202,196
Interest Rate
7.85%
Create a Home Valuation Report for This Property
The Home Valuation Report is an in-depth analysis detailing your home's value as well as a comparison with similar homes in the area
Home Values in the Area
Average Home Value in this Area
Purchase History
| Date | Buyer | Sale Price | Title Company |
|---|---|---|---|
| Mason Margaret Bartram | $375,000 | Land Title Guarantee Company | |
| Spangler Richard W | $315,000 | Land Title Guarantee Company | |
| Wimer Kevin B | $252,745 | First American Heritage Titl | |
| J D Collins Construction Inc | -- | -- |
Source: Public Records
Mortgage History
| Date | Status | Borrower | Loan Amount |
|---|---|---|---|
| Previous Owner | Wimer Kevin B | $202,196 |
Source: Public Records
Tax History Compared to Growth
Tax History
| Year | Tax Paid | Tax Assessment Tax Assessment Total Assessment is a certain percentage of the fair market value that is determined by local assessors to be the total taxable value of land and additions on the property. | Land | Improvement |
|---|---|---|---|---|
| 2025 | $3,594 | $36,944 | $6,419 | $30,525 |
| 2024 | $3,594 | $36,944 | $6,419 | $30,525 |
| 2023 | $3,545 | $37,574 | $7,370 | $33,889 |
| 2022 | $3,131 | $31,637 | $5,595 | $26,042 |
| 2021 | $3,171 | $32,547 | $5,756 | $26,791 |
| 2020 | $2,883 | $29,680 | $5,148 | $24,532 |
| 2019 | $2,838 | $29,680 | $5,148 | $24,532 |
| 2018 | $2,556 | $26,906 | $5,256 | $21,650 |
| 2017 | $2,521 | $29,747 | $5,811 | $23,936 |
| 2016 | $2,576 | $26,945 | $5,970 | $20,975 |
| 2015 | $2,454 | $24,175 | $7,244 | $16,931 |
| 2014 | -- | $24,175 | $7,244 | $16,931 |
Source: Public Records
Map
Nearby Homes
- 3729 Doral Dr
- 10930 N 85th St
- 1229 Twin Peaks Cir
- 3316 Camden Dr
- 3514 Mountain View Ave
- 3721 Columbia Dr
- 161 Baylor Dr
- 2900 Troxell Ave
- 3806 Findlay Ln
- 825 Wade Rd
- 712 Wade Rd
- 1106 Purdue Dr
- 1440 Northwestern Rd
- 1345 Northwestern Rd
- 1013 Berkeley Ct
- 1429 Auburn Ct
- 2810 Humboldt Cir
- 1037 Purdue Dr
- 1545 Drake St
- 2888 Humboldt Cir
- 1005 Champion Cir
- 1015 Champion Cir
- 1001 Champion Cir
- 1019 Champion Cir
- 1195 Twin Peaks Cir
- 971 Champion Cir
- 1036 Champion Cir
- 1193 Twin Peaks Cir
- 1197 Twin Peaks Cir
- 1023 Champion Cir
- 967 Champion Cir
- 1033 Champion Cir
- 926 Champion Cir
- 1201 Twin Peaks Cir
- 1037 Champion Cir
- 966 Champion Cir
- 963 Champion Cir
- 1044 Champion Cir
- 1041 Champion Cir
- 962 Champion Cir