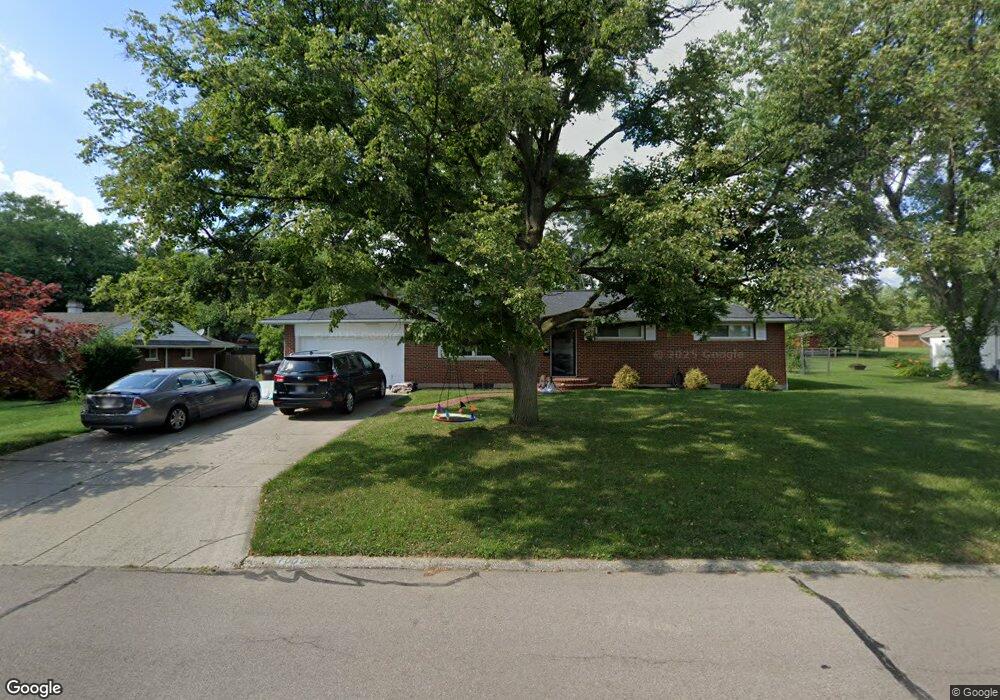
1009 Donson Dr Dayton, OH 45429
Estimated Value: $289,000 - $318,000
3
Beds
2
Baths
1,334
Sq Ft
$225/Sq Ft
Est. Value
About This Home
This home is located at 1009 Donson Dr, Dayton, OH 45429 and is currently estimated at $300,340, approximately $225 per square foot. 1009 Donson Dr is a home located in Montgomery County with nearby schools including John F. Kennedy Elementary School, Kettering Middle School, and Kettering Fairmont High School.
Ownership History
Date
Name
Owned For
Owner Type
Purchase Details
Closed on
Jun 25, 2021
Sold by
Hinkebein Bridget M and Hinkebein Jason
Bought by
Espy Kyle Paul and Espy Tonya
Current Estimated Value
Home Financials for this Owner
Home Financials are based on the most recent Mortgage that was taken out on this home.
Original Mortgage
$248,640
Outstanding Balance
$225,946
Interest Rate
3%
Mortgage Type
VA
Estimated Equity
$74,394
Purchase Details
Closed on
Jan 9, 2013
Sold by
Heck John K and Hecks Barbara L
Bought by
Malesko Bridget M
Home Financials for this Owner
Home Financials are based on the most recent Mortgage that was taken out on this home.
Original Mortgage
$123,226
Interest Rate
3.25%
Mortgage Type
FHA
Purchase Details
Closed on
Feb 26, 2009
Sold by
Heck Barbara L and Heck John K
Bought by
Heck Barbara L and Heck John K
Purchase Details
Closed on
Apr 22, 1994
Sold by
Heck Barbara L and Bingham Barbara L
Bought by
Heck Barbara L and Heck John K
Create a Home Valuation Report for This Property
The Home Valuation Report is an in-depth analysis detailing your home's value as well as a comparison with similar homes in the area
Home Values in the Area
Average Home Value in this Area
Purchase History
| Date | Buyer | Sale Price | Title Company |
|---|---|---|---|
| Espy Kyle Paul | $240,000 | Landmark Ttl Agcy South Inc | |
| Malesko Bridget M | $125,500 | Landmark Title Agency South | |
| Heck Barbara L | -- | Attorney | |
| Heck Barbara L | -- | -- |
Source: Public Records
Mortgage History
| Date | Status | Borrower | Loan Amount |
|---|---|---|---|
| Open | Espy Kyle Paul | $248,640 | |
| Previous Owner | Malesko Bridget M | $123,226 |
Source: Public Records
Tax History Compared to Growth
Tax History
| Year | Tax Paid | Tax Assessment Tax Assessment Total Assessment is a certain percentage of the fair market value that is determined by local assessors to be the total taxable value of land and additions on the property. | Land | Improvement |
|---|---|---|---|---|
| 2024 | $5,011 | $80,870 | $13,860 | $67,010 |
| 2023 | $5,011 | $80,870 | $13,860 | $67,010 |
| 2022 | $4,813 | $61,430 | $10,500 | $50,930 |
| 2021 | $4,451 | $61,430 | $10,500 | $50,930 |
| 2020 | $4,464 | $61,430 | $10,500 | $50,930 |
| 2019 | $3,973 | $48,320 | $10,500 | $37,820 |
| 2018 | $3,995 | $48,320 | $10,500 | $37,820 |
| 2017 | $3,679 | $48,320 | $10,500 | $37,820 |
| 2016 | $3,698 | $45,640 | $10,500 | $35,140 |
| 2015 | $3,532 | $45,640 | $10,500 | $35,140 |
| 2014 | $3,532 | $45,640 | $10,500 | $35,140 |
| 2012 | -- | $49,440 | $11,270 | $38,170 |
Source: Public Records
Map
Nearby Homes
- 1049 Georgian Dr
- 4817 Ackerman Blvd
- 5017 Ackerman Blvd
- 730 Hyde Park Dr
- 321 Princewood Ave
- 5155 Marshall Rd
- 617 Laurelann Dr
- 4541 Acreview Ln
- 4640 Marshall Rd
- 501 Judith Dr
- 1310 Partridge Run Cir Unit 1310
- 5328 Landau Dr Unit 49
- 5328 Landau Dr
- 1033 Carlo Dr
- 1008 Rio Ln
- 5380 Landau Dr Unit 40
- 5416 Landau Dr Unit 7
- 5416 Landau Dr Unit 5
- 5536 Durwood St
- 5536 Durwood Rd
- 4916 Georgian Dr
- 4908 Georgian Dr
- 1025 Donson Dr
- 1016 Georgian Dr
- 1008 Donson Dr
- 1016 Donson Dr
- 1024 Georgian Dr
- 4950 Georgian Dr
- 4917 Georgian Dr
- 1024 Donson Dr
- 1033 Donson Dr
- 4909 Georgian Dr
- 4901 Georgian Dr
- 1032 Georgian Dr
- 1001 Georgian Dr
- 1032 Donson Dr
- 4951 Georgian Dr
- 1009 Georgian Dr
- 1041 Donson Dr
- 965 Donson Dr