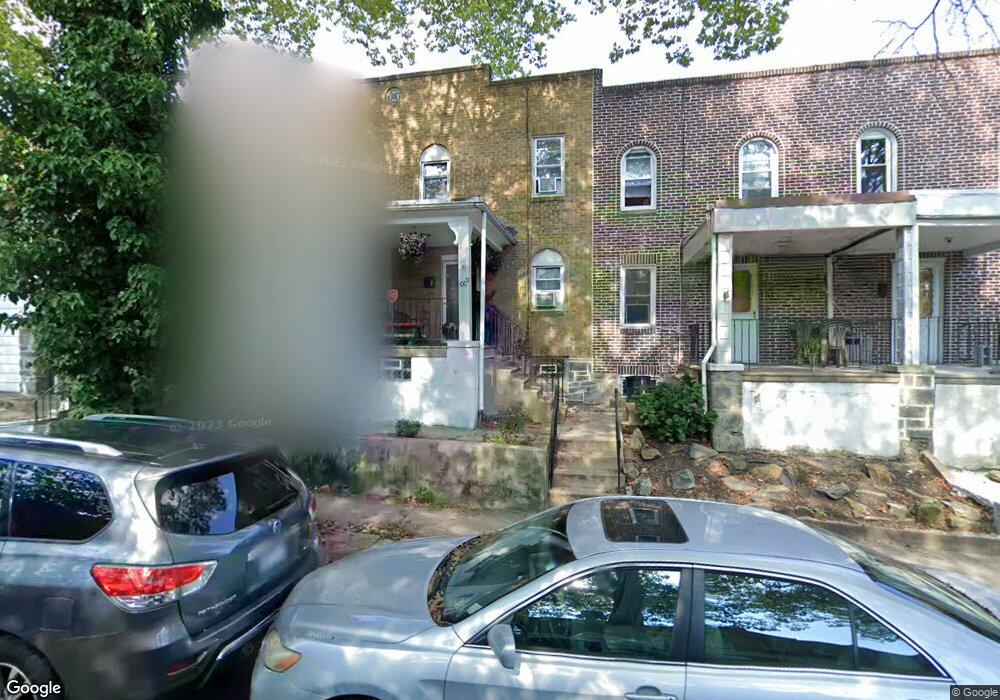
1009 Edgemore Rd Philadelphia, PA 19151
Overbrook NeighborhoodEstimated Value: $125,000 - $187,000
2
Beds
1
Bath
800
Sq Ft
$197/Sq Ft
Est. Value
About This Home
This home is located at 1009 Edgemore Rd, Philadelphia, PA 19151 and is currently estimated at $157,830, approximately $197 per square foot. 1009 Edgemore Rd is a home located in Philadelphia County with nearby schools including Overbrook High School, Ad Prima Charter School, and Harambee Institute of Science and Techno.
Ownership History
Date
Name
Owned For
Owner Type
Purchase Details
Closed on
Jun 28, 2011
Sold by
Fannie Mae
Bought by
Summer Properties Lp
Current Estimated Value
Purchase Details
Closed on
Aug 30, 2010
Sold by
Blackledge Patricia and Blackledge James
Bought by
Federal National Mortgage Association
Purchase Details
Closed on
Aug 5, 2002
Sold by
Manufacturers & Traders Trust Company
Bought by
Blackledge James and Blackledge Patricia
Purchase Details
Closed on
Jun 19, 2002
Sold by
Schiavo Anthony and Schiavo Lorraine Rose
Bought by
Manufacturers & Traders Trust Company
Purchase Details
Closed on
Sep 26, 2000
Sold by
Schiavo Anthony and Schiavo Lorraine R
Bought by
Smith Ontwon and Trust #1009
Purchase Details
Closed on
Jun 25, 1998
Sold by
Schiavo Anthony
Bought by
Schiavo Anthony and Schiavo Lorraine R
Purchase Details
Closed on
Mar 23, 1998
Sold by
Schiavo Deborah L and Petrongolo Deborah L
Bought by
Schiavo Anthony
Create a Home Valuation Report for This Property
The Home Valuation Report is an in-depth analysis detailing your home's value as well as a comparison with similar homes in the area
Home Values in the Area
Average Home Value in this Area
Purchase History
| Date | Buyer | Sale Price | Title Company |
|---|---|---|---|
| Summer Properties Lp | $36,000 | First American Title Ins Co | |
| Federal National Mortgage Association | $3,800 | None Available | |
| Blackledge James | $30,000 | -- | |
| Manufacturers & Traders Trust Company | $30,000 | -- | |
| Smith Ontwon | -- | -- | |
| Schiavo Anthony | -- | -- | |
| Schiavo Anthony | -- | -- |
Source: Public Records
Tax History Compared to Growth
Tax History
| Year | Tax Paid | Tax Assessment Tax Assessment Total Assessment is a certain percentage of the fair market value that is determined by local assessors to be the total taxable value of land and additions on the property. | Land | Improvement |
|---|---|---|---|---|
| 2025 | $1,557 | $127,000 | $25,400 | $101,600 |
| 2024 | $1,557 | $127,000 | $25,400 | $101,600 |
| 2023 | $1,557 | $111,200 | $22,240 | $88,960 |
| 2022 | $1,191 | $111,200 | $22,240 | $88,960 |
| 2021 | $1,191 | $0 | $0 | $0 |
| 2020 | $1,191 | $85,100 | $12,765 | $72,335 |
| 2019 | $1,148 | $0 | $0 | $0 |
| 2018 | $728 | $0 | $0 | $0 |
| 2017 | $728 | $0 | $0 | $0 |
| 2016 | $728 | $0 | $0 | $0 |
| 2015 | $697 | $0 | $0 | $0 |
| 2014 | -- | $52,000 | $9,330 | $42,670 |
| 2012 | -- | $10,208 | $1,696 | $8,512 |
Source: Public Records
Map
Nearby Homes
- 924 N 66th St
- 947 N 66th St
- 6528 Lebanon Ave
- 6618 Malvern Ave
- 1004 N 66th St
- 6626 Haddington Ln
- 925 Marlyn Rd
- 1200 N 64th St
- 1258 N 64th St
- 717 N 67th St
- 706 Edgemore Rd
- 6452 Lansdowne Ave
- 703 N 66th St
- 657 N 66th St
- 6451 Woodcrest Ave
- 621 N 67th St
- 653 Atwood Rd
- 6647 Haverford Ave
- 716 N 64th St
- 6015 Haverford Ave
- 1007 Edgemore Rd
- 1011 Edgemore Rd
- 1005 Edgemore Rd
- 1013 Edgemore Rd
- 1015 Edgemore Rd
- 1003 Edgemore Rd
- 1017 Edgemore Rd
- 1001 Edgemore Rd
- 941 Edgemore Rd
- 1019 Edgemore Rd
- 939 Edgemore Rd
- 944 N 66th St
- 1021 Edgemore Rd
- 946 N 66th St
- 942 N 66th St
- 940 N 66th St
- 938 N 66th St
- 1008 Edgemore Rd
- 1023 Edgemore Rd
- 948 N 66th St Unit 2ND FL