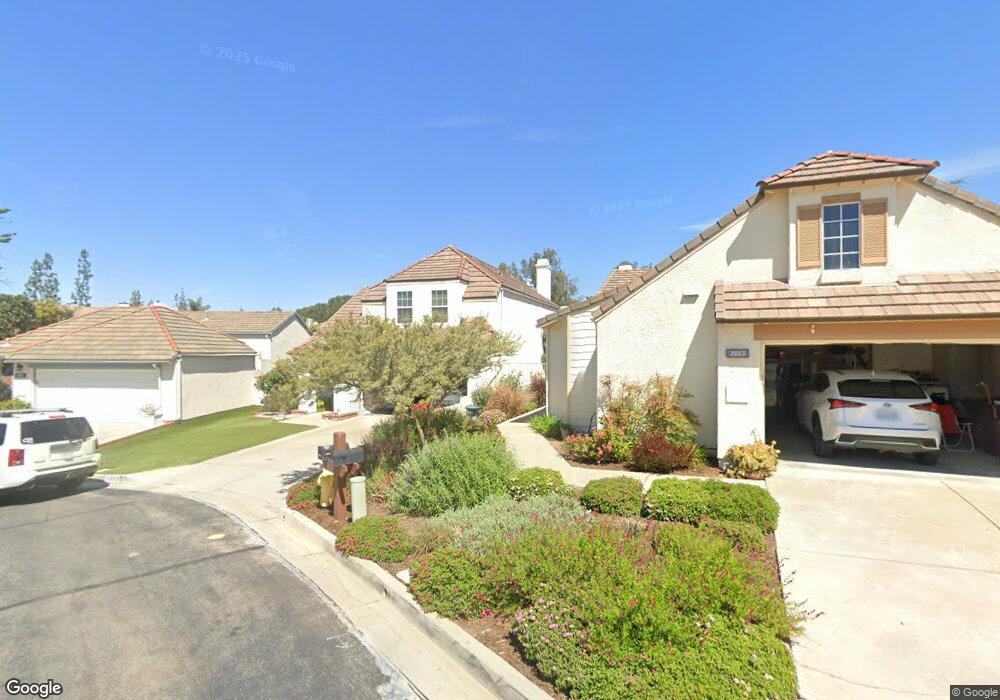
1009 Henrietta Cir Placentia, CA 92870
Estimated Value: $1,085,228 - $1,155,000
3
Beds
3
Baths
1,839
Sq Ft
$601/Sq Ft
Est. Value
About This Home
This home is located at 1009 Henrietta Cir, Placentia, CA 92870 and is currently estimated at $1,105,307, approximately $601 per square foot. 1009 Henrietta Cir is a home located in Orange County with nearby schools including Morse Avenue Elementary School, Kraemer Middle School, and Valencia High School.
Ownership History
Date
Name
Owned For
Owner Type
Purchase Details
Closed on
Oct 29, 2008
Sold by
Sweet Justin and Sweet Julie
Bought by
Salgado Shiran and Salgado Sirangi
Current Estimated Value
Home Financials for this Owner
Home Financials are based on the most recent Mortgage that was taken out on this home.
Original Mortgage
$400,000
Outstanding Balance
$266,305
Interest Rate
6.37%
Mortgage Type
Purchase Money Mortgage
Estimated Equity
$839,002
Purchase Details
Closed on
Sep 7, 1999
Sold by
Johnson Stanford H and Johnson Jacquelyn K
Bought by
Sweet Justin and Sweet Julie
Home Financials for this Owner
Home Financials are based on the most recent Mortgage that was taken out on this home.
Original Mortgage
$251,720
Interest Rate
8.05%
Create a Home Valuation Report for This Property
The Home Valuation Report is an in-depth analysis detailing your home's value as well as a comparison with similar homes in the area
Home Values in the Area
Average Home Value in this Area
Purchase History
| Date | Buyer | Sale Price | Title Company |
|---|---|---|---|
| Salgado Shiran | $500,000 | Lawyers Title Company | |
| Sweet Justin | $280,000 | North American Title Co |
Source: Public Records
Mortgage History
| Date | Status | Borrower | Loan Amount |
|---|---|---|---|
| Open | Salgado Shiran | $400,000 | |
| Previous Owner | Sweet Justin | $251,720 |
Source: Public Records
Tax History
| Year | Tax Paid | Tax Assessment Tax Assessment Total Assessment is a certain percentage of the fair market value that is determined by local assessors to be the total taxable value of land and additions on the property. | Land | Improvement |
|---|---|---|---|---|
| 2025 | $7,521 | $643,875 | $399,137 | $244,738 |
| 2024 | $7,521 | $631,250 | $391,310 | $239,940 |
| 2023 | $7,364 | $618,873 | $383,637 | $235,236 |
| 2022 | $7,260 | $606,739 | $376,115 | $230,624 |
| 2021 | $7,089 | $594,843 | $368,741 | $226,102 |
| 2020 | $7,110 | $588,744 | $364,960 | $223,784 |
| 2019 | $6,828 | $577,200 | $357,803 | $219,397 |
| 2018 | $6,740 | $565,883 | $350,787 | $215,096 |
| 2017 | $6,625 | $554,788 | $343,909 | $210,879 |
| 2016 | $6,492 | $543,910 | $337,165 | $206,745 |
| 2015 | $6,408 | $535,740 | $332,100 | $203,640 |
| 2014 | $6,225 | $525,246 | $325,595 | $199,651 |
Source: Public Records
Map
Nearby Homes
- 1000 Henrietta Cir
- 1232 E Providence Loop
- 1232 Woodside Dr
- 1261 Brian St
- 1234 Verona Place
- 1126 Naples Ave
- 5142 Hamer Ln
- 1330 Limerick Dr
- 525 Dickinson Cir
- 635 Patten Ave
- 642 Patten Ave
- 623 Patten Ave
- 617 Patten Ave
- 605 Patten Ave
- 607 Patten Ave
- 731 Langer Dr
- 603 Patten Ave
- 1270 E Providence Loop
- 581 Patten Ave
- 747 De Jesus Dr
- 1013 Henrietta Cir
- 1004 Powell Dr
- 1001 Henrietta Cir
- 1008 Powell Dr
- 1000 Powell Dr
- 1017 Henrietta Cir
- 1012 Powell Dr
- 1005 Henrietta Cir
- 1021 Henrietta Cir
- 1016 Powell Dr
- 1004 Henrietta Cir
- 1012 Henrietta Cir
- 1016 Henrietta Cir
- 1008 Henrietta Cir
- 1025 Henrietta Cir
- 1020 Henrietta Cir
- 1020 Powell Dr
- 1009 Powell Dr
- 1005 Powell Dr
- 1013 Powell Dr
Your Personal Tour Guide
Ask me questions while you tour the home.