Estimated Value: $62,000 - $82,000
2
Beds
2
Baths
1,670
Sq Ft
$43/Sq Ft
Est. Value
About This Home
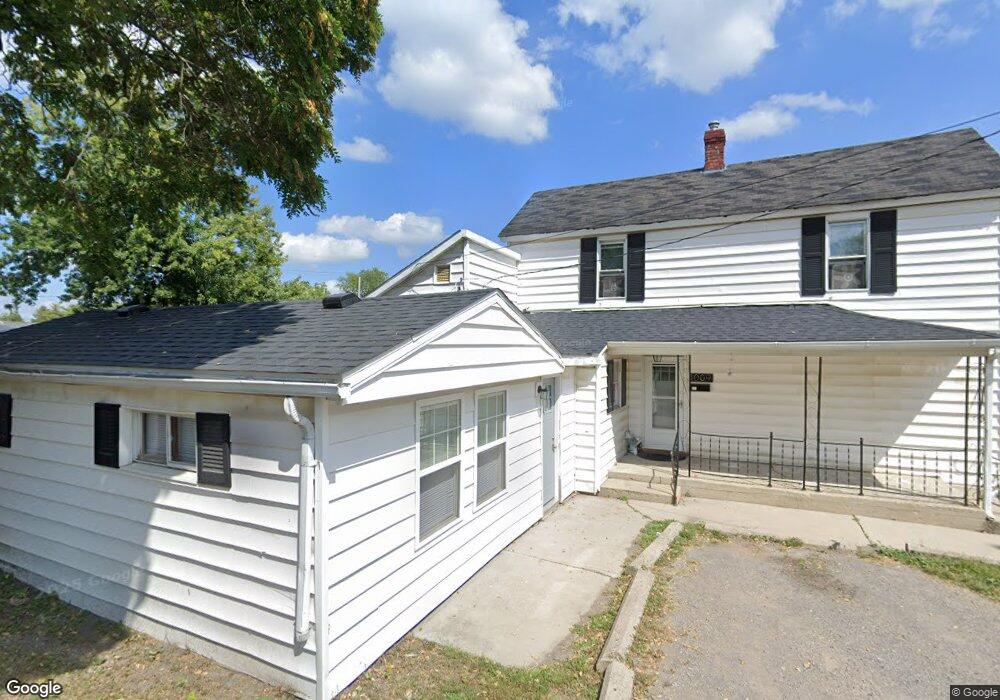
This home is located at 1009 Linden St, Lima, OH 45804 and is currently estimated at $72,448, approximately $43 per square foot. 1009 Linden St is a home located in Allen County with nearby schools including Freedom Elementary School, Lima North Middle School, and Lima West Middle School.
Ownership History
Date
Name
Owned For
Owner Type
Purchase Details
Closed on
Aug 9, 2022
Sold by
3Bees Rentals Llc
Bought by
Timothy James Investments Llc
Current Estimated Value
Home Financials for this Owner
Home Financials are based on the most recent Mortgage that was taken out on this home.
Original Mortgage
$60,000
Outstanding Balance
$57,449
Interest Rate
5.7%
Mortgage Type
Seller Take Back
Estimated Equity
$15,000
Purchase Details
Closed on
Jul 27, 2021
Sold by
Tarter John L and Tarter Claudia S
Bought by
3Bees Rentals Llc
Purchase Details
Closed on
Jan 30, 2007
Sold by
Tarter Daniel M
Bought by
Tarter John L and Tarter Claudia S
Purchase Details
Closed on
Jan 23, 2005
Sold by
Tarter John L and The Estate Of James M Tarter
Bought by
Tarter Daniel M
Purchase Details
Closed on
May 28, 1997
Sold by
Bishop Kevin
Bought by
James Tarter
Purchase Details
Closed on
Oct 29, 1990
Bought by
Bishop Kevin E
Create a Home Valuation Report for This Property
The Home Valuation Report is an in-depth analysis detailing your home's value as well as a comparison with similar homes in the area
Home Values in the Area
Average Home Value in this Area
Purchase History
| Date | Buyer | Sale Price | Title Company |
|---|---|---|---|
| Timothy James Investments Llc | $60,000 | Knueve Sahloff & Wildenhaus Ll | |
| 3Bees Rentals Llc | $52,500 | None Available | |
| Tarter John L | $25,000 | None Available | |
| Tarter Daniel M | $20,000 | None Available | |
| James Tarter | $25,000 | -- | |
| Bishop Kevin E | $25,000 | -- |
Source: Public Records
Mortgage History
| Date | Status | Borrower | Loan Amount |
|---|---|---|---|
| Open | Timothy James Investments Llc | $60,000 |
Source: Public Records
Tax History Compared to Growth
Tax History
| Year | Tax Paid | Tax Assessment Tax Assessment Total Assessment is a certain percentage of the fair market value that is determined by local assessors to be the total taxable value of land and additions on the property. | Land | Improvement |
|---|---|---|---|---|
| 2024 | $405 | $9,630 | $1,120 | $8,510 |
| 2023 | $485 | $9,140 | $1,050 | $8,090 |
| 2022 | $434 | $9,140 | $1,050 | $8,090 |
| 2021 | $509 | $9,140 | $1,050 | $8,090 |
| 2020 | $520 | $9,390 | $950 | $8,440 |
| 2019 | $520 | $9,390 | $950 | $8,440 |
| 2018 | $514 | $9,390 | $950 | $8,440 |
| 2017 | $521 | $9,390 | $950 | $8,440 |
| 2016 | $529 | $9,390 | $950 | $8,440 |
| 2015 | $556 | $9,390 | $950 | $8,440 |
| 2014 | $556 | $9,810 | $1,020 | $8,790 |
| 2013 | $542 | $9,810 | $1,020 | $8,790 |
Source: Public Records
Map
Nearby Homes
- 806 Bellefontaine Ave
- 00 Bellefontaine Ave
- 620 E Elm St Unit 1/2
- 520 Orena Ave
- 145 S Pine St
- 129 S Pine St
- 524 S Collins Ave
- 706 E Kibby St
- 380 S Pine St
- 600 Dingledine Ave
- 439 E Mckibben St
- 4 package Rentals
- 622 N Jefferson St
- 306 E Vine St
- 1093 S Sugar St
- 839 Saint Johns Ave
- 1008 Fairview Ave
- 620 Willard Ave
- 2223 Makin Dr
- 11 Unit Multi Family and Sfh