NOT LISTED FOR SALE

1009 N Market St Sparta, IL 62286

Estimated Value: $124,000 - $209,000

4 Beds
1 Bath
2,472 Sq Ft
$67/Sq Ft Est. Value

Last Sold March 21, 2014

Last sale price $42,000 $17 Per Sq Ft

Est. 296% increase in value since last sale

Current estimated payment $1,238/month

338 Days on Market

Highlights

  • Porch
  • Patio
  • Garage

About This Home

As of March 2014

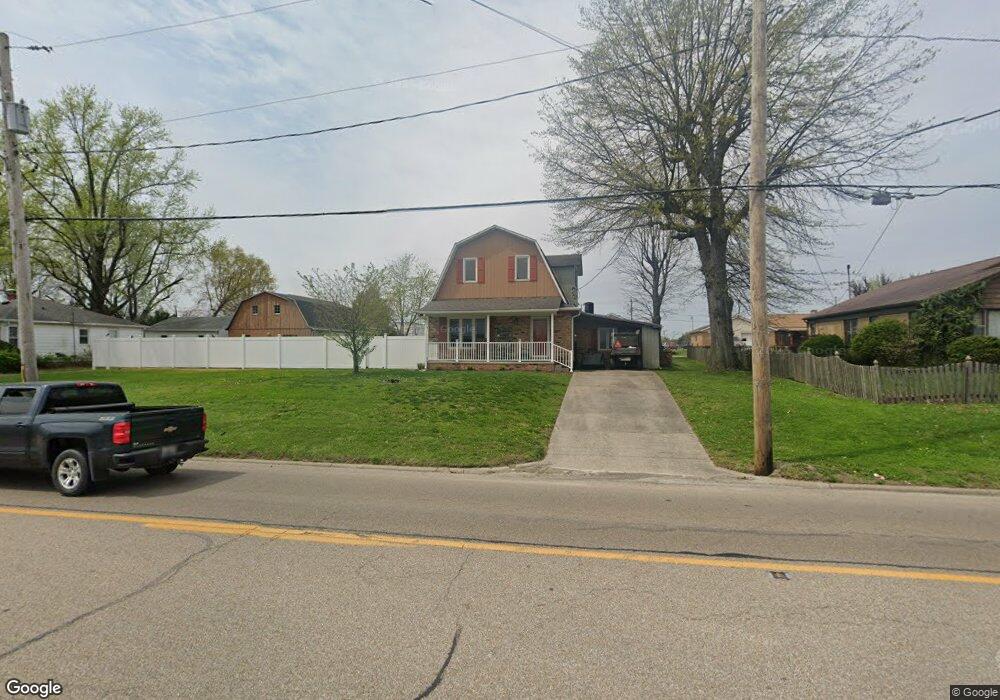
Spacious 4 BR home close to schools. Needs some work. Priced to sell. Garage with loft. Plenty of storage. None

Last Agent to Sell the Property

Sam Shaw

TRI COUNTY REALTY, INC. License #475128714 Listed on: 03/14/2013

Last Buyer's Agent

Pat Willard

TRI COUNTY REALTY, INC. License #475.121967

Home Details

Home Type

  • Single Family

Year Built

  • Built in 1957

Lot Details

  • 0.31

Parking

  • Garage

Home Design

  • Frame Construction

Interior Spaces

  • 1 Full Bathroom
  • 2-Story Property
  • Sump Pump

Outdoor Features

  • Patio
  • Porch

Schools

  • Sparta Elementary School

Home Details

Home Type

Single Family

Year Built

Built in 1957

Lot Details

0

Listing Details

  • Class: Residential
  • Type: Single Family
  • Style: 2 Story
  • Unit Style: 1-Level
  • Legal Description: Lots 10 & 11 BLK 2 T. G. Dean's Addition
  • Year Built: 1957
  • Special Features: None
  • Property Sub Type: Detached
  • Stories: 2

Interior Features

  • Total Bathrooms: 3
  • Total Full Baths: 1
  • Bedrooms: 4
  • Basement Foundation: Partial, Slab, Partially Finished
  • Kitchen Dining: Pantry
  • Basement Finished Sq Ft: 517
  • Total Basement Sq Ft: 517
  • Price Per Sq Ft: 21.48
  • Finished Sq Ft: 2472
  • Total Sq Ft: 1955
  • Finished Main Level Sq Ft: 1955

Exterior Features

  • Exterior: Brick, Wood Siding
  • Exterior Amenities: Patio, Porch
  • Road Access: Alley, Paved
  • Roofing: Shingles
  • Construction Type: Frame

Garage/Parking

  • Garage Parking: Detached
  • Garage Yn: Yes
  • Number Cars: 2

Utilities

  • Heating Cooling: No Cooling
  • Water Sewer: Public Water, Public Sewer, Sump Pump
  • Utility Companies: Ameren City Ameren IP

Schools

  • Elementary School: Sparta

Lot Info

  • Estimated Lot Size: 120' x 112'
  • Zoning: Residential
  • Geo Subdivision: IL

Tax Info

  • Annual Taxes: 3467
  • Parcel Id Number Tax Id: 19-109-009-00
  • Tax Year: 2012

MLS Schools

  • High School School District: Sparta

Ownership History

Date Name Owned For Owner Type

Purchase Details

Listed on
Mar 14, 2013
Closed on
Mar 21, 2014
Sold by
Diercks Betty W
Bought by
Wilson Henry and Wilson Dara
Seller's Agent
Sam Shaw
TRI COUNTY REALTY, INC.
Buyer's Agent
Pat Willard
TRI COUNTY REALTY, INC.
List Price
$89,000
Sold Price
$42,000
Premium/Discount to List
-$47,000
-52.81%
Current Estimated Value
$166,309

Home Financials for this Owner

Home Financials are based on the most recent Mortgage that was taken out on this home.
Estimated Appreciation
$124,309
Avg. Annual Appreciation
12.58%
Original Mortgage
$57,000
Outstanding Balance
$30,158
Interest Rate
4.24%
Mortgage Type
Future Advance Clause Open End Mortgage
Estimated Equity
$136,151

Purchase Details

Closed on
Feb 11, 2012
Sold by
Diercks Betty W
Bought by
Ronald A Diercks Living Trust and Diereks Roland A
Source: Public Records

Range of Values:

Collateral Analytics

Collateral Analytics Collateral Analytics AVMs (Automated Valuation Model) employ a number of statistical approaches combined with neighborhood-specific comparable selection guarantees the most up-to-date and precise valuations.

Not Available

Collateral Analytics does not have data for the current month. Please view the chart for historical values.

ICE

ICE Mortgage Technology ICE Mortgage Technology’s AVM (Automated Valuation Model) is a state-of-the-art online residential property valuation tool that provides a quick and accurate estimate of the value of almost any home in the U.S.

Not Available

ICE Mortgage Technology does not have data for the current month. Please view the chart for historical values.

First American

First American First American Data & Analytics’ next-generation AVM combines unrivaled data assets with a blended ensemble of valuation models to produce highly accurate, reliable valuations you can trust.

Not Available

First American does not have data for the current month. Please view the chart for historical values.

Quantarium

Quantarium Quantarium’s valuation service, repeatedly proven the industry’s most accurate and comprehensive, is supercharged with a self-learning and auto-tuning AI engine that continually becomes smarter and more accurate as it processes daily inputs from the industry’s leading RE data lake.

Not Available

Quantarium does not have data for the current month. Please view the chart for historical values.

Average Value
Not Available
List Price
Sold Price
Create a Home Valuation Report for This Property
The Home Valuation Report is an in-depth analysis detailing your home's value as well as a comparison with similar homes in the area

Home Values in the Area

Source: Public Records

Average Home Value in this Area


Source: Public Records

Purchase History

Date Buyer Sale Price Title Company
Wilson Henry $42,000 None Available
Ronald A Diercks Living Trust -- None Available
Source: Public Records

Mortgage History

Date Status Borrower Loan Amount
Open Wilson Henry $57,000
Source: Public Records

Property History

Date Event Price List to Sale Price per Sq Ft
03/21/2014 03/21/14 Sold $42,000 -52.8% $17 / Sq Ft
02/15/2014 02/15/14 Pending -- -- --
03/14/2013 03/14/13 For Sale $89,000 -- $36 / Sq Ft
Source: RMLS Alliance

Tax History Compared to Growth

Source: Public Records

Tax History

Year Tax Paid Tax Assessment Tax Assessment Total Assessment is a certain percentage of the fair market value that is determined by local assessors to be the total taxable value of land and additions on the property. Land Improvement
2024 $4,359 $51,955 $3,950 $48,005
2023 $4,090 $49,120 $3,670 $45,450
2022 $38 $16,130 $3,420 $12,710
2021 $1,419 $15,220 $3,225 $11,995
2020 $1,302 $15,586 $3,304 $12,282
2019 $1,279 $13,945 $2,955 $10,990
2018 $1,279 $15,374 $3,258 $12,116
2017 $1,132 $14,070 $2,980 $11,090
2016 $1,195 $13,555 $2,870 $10,685
2015 $1,184 $13,555 $2,870 $10,685
2014 $1,184 $13,820 $2,925 $10,895
2013 $3,467 $32,085 $2,960 $29,125
Source: Public Records

Agents Affiliated with this Home

  • Section Image
See All Agents

Map

Source: RMLS Alliance

MLS Number: RMAEB317044

RMLS Alliance

APN: 19-109-009-00