Estimated Value: $233,000 - $258,000
3
Beds
2
Baths
1,438
Sq Ft
$169/Sq Ft
Est. Value
About This Home
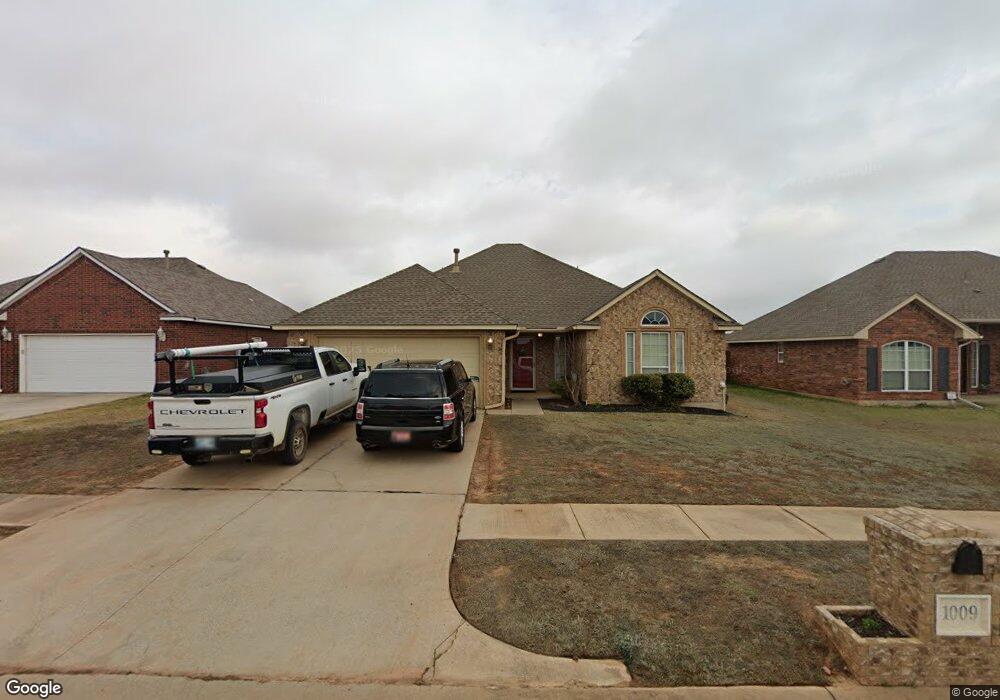
This home is located at 1009 NE 32nd St, Moore, OK 73160 and is currently estimated at $243,394, approximately $169 per square foot. 1009 NE 32nd St is a home located in Cleveland County with nearby schools including Bryant Elementary School, Central Junior High School, and Moore High School.
Ownership History
Date
Name
Owned For
Owner Type
Purchase Details
Closed on
Jul 10, 2008
Sold by
Wall Stephen A and Wall Rachel S
Bought by
Aguilar Jose Angel
Current Estimated Value
Home Financials for this Owner
Home Financials are based on the most recent Mortgage that was taken out on this home.
Original Mortgage
$139,900
Outstanding Balance
$90,345
Interest Rate
6.09%
Mortgage Type
VA
Estimated Equity
$153,049
Purchase Details
Closed on
Aug 25, 2006
Sold by
Avadon Homes Llc
Bought by
Wall Stephen A and Wall Rachel S
Home Financials for this Owner
Home Financials are based on the most recent Mortgage that was taken out on this home.
Original Mortgage
$124,800
Interest Rate
6.75%
Mortgage Type
New Conventional
Create a Home Valuation Report for This Property
The Home Valuation Report is an in-depth analysis detailing your home's value as well as a comparison with similar homes in the area
Home Values in the Area
Average Home Value in this Area
Purchase History
| Date | Buyer | Sale Price | Title Company |
|---|---|---|---|
| Aguilar Jose Angel | $137,000 | The Oklahoma City Abstract & | |
| Wall Stephen A | $128,500 | None Available |
Source: Public Records
Mortgage History
| Date | Status | Borrower | Loan Amount |
|---|---|---|---|
| Open | Aguilar Jose Angel | $139,900 | |
| Previous Owner | Wall Stephen A | $124,800 |
Source: Public Records
Tax History Compared to Growth
Tax History
| Year | Tax Paid | Tax Assessment Tax Assessment Total Assessment is a certain percentage of the fair market value that is determined by local assessors to be the total taxable value of land and additions on the property. | Land | Improvement |
|---|---|---|---|---|
| 2024 | $2,706 | $22,307 | $4,144 | $18,163 |
| 2023 | $2,589 | $21,245 | $3,935 | $17,310 |
| 2022 | $2,503 | $20,233 | $3,836 | $16,397 |
| 2021 | $2,395 | $19,270 | $3,994 | $15,276 |
| 2020 | $2,280 | $18,352 | $4,058 | $14,294 |
| 2019 | $2,213 | $17,478 | $3,000 | $14,478 |
| 2018 | $2,214 | $17,479 | $3,000 | $14,479 |
| 2017 | $2,225 | $17,479 | $0 | $0 |
| 2016 | $2,205 | $17,198 | $2,952 | $14,246 |
| 2015 | $1,900 | $16,379 | $2,786 | $13,593 |
| 2014 | $1,852 | $15,599 | $2,766 | $12,833 |
Source: Public Records
Map
Nearby Homes
- 1025 NE 32nd St
- 929 NE 28th St
- 1001 NE 34th Terrace
- 1201 NE 26th St
- 1500 NE 33rd Terrace
- 1624 NE 32nd St
- 1216 NE 24th St
- 3505 Erie Dr
- 1428 NE 26th St
- Belmore Plus Plan at Sweetwater
- Wayne Plan at Sweetwater
- Belmore Plus Select Plan at Sweetwater - Select
- Belmore Select Plan at Sweetwater - Select
- Charlotte Plan at Sweetwater
- Charlotte Select Plan at Sweetwater - Select
- Duxbury Select Plan at Sweetwater - Select
- Alistair Plan at Sweetwater
- Abingdon Select Plan at Sweetwater - Select
- Brady Plan at Sweetwater
- Bristol Plan at Sweetwater
- 1005 NE 32nd St
- 1013 NE 32nd St
- 1017 NE 32nd St
- 1012 NE 32nd St
- 1008 NE 32nd St
- 1016 NE 32nd St
- 1021 NE 32nd St
- 3401 Michigan Ave
- 3209 Loren Dr
- 3200 Loren Dr
- 3205 Loren Dr
- 1020 NE 32nd St
- 3209 Gabriel Ct
- 3409 Michigan Ave
- 3201 Loren Dr
- 3400 Superior Dr
- 3120 Loren Dr
- 3405 Michigan Ave
- 1012 NE 33rd Terrace