1009 Oak Twig Dr Raleigh, NC 27603
Estimated Value: $370,000 - $532,283
3
Beds
3
Baths
1,600
Sq Ft
$286/Sq Ft
Est. Value
About This Home
This home is located at 1009 Oak Twig Dr, Raleigh, NC 27603 and is currently estimated at $458,321, approximately $286 per square foot. 1009 Oak Twig Dr is a home located in Wake County with nearby schools including Banks Road Elementary School.
Ownership History
Date
Name
Owned For
Owner Type
Purchase Details
Closed on
Jul 29, 2021
Sold by
Chromy Miroslav and Jaklinova Viadimira
Bought by
Chromy Miroslav and Jaklinova Vladimira
Current Estimated Value
Home Financials for this Owner
Home Financials are based on the most recent Mortgage that was taken out on this home.
Original Mortgage
$221,000
Outstanding Balance
$201,048
Interest Rate
2.93%
Mortgage Type
New Conventional
Estimated Equity
$257,273
Purchase Details
Closed on
Oct 22, 2019
Sold by
Chromy Sarah and Chromy Miroslav
Bought by
Chromy Miroslav
Purchase Details
Closed on
May 2, 2005
Sold by
Rhodes Daniel L and Rhodes Laura Sue
Bought by
Chromy Miroslav and Chromy Sarah
Home Financials for this Owner
Home Financials are based on the most recent Mortgage that was taken out on this home.
Original Mortgage
$100,800
Interest Rate
5.5%
Mortgage Type
Fannie Mae Freddie Mac
Create a Home Valuation Report for This Property
The Home Valuation Report is an in-depth analysis detailing your home's value as well as a comparison with similar homes in the area
Home Values in the Area
Average Home Value in this Area
Purchase History
| Date | Buyer | Sale Price | Title Company |
|---|---|---|---|
| Chromy Miroslav | -- | None Available | |
| Chromy Miroslav | -- | None Available | |
| Chromy Miroslav | $126,000 | -- |
Source: Public Records
Mortgage History
| Date | Status | Borrower | Loan Amount |
|---|---|---|---|
| Open | Chromy Miroslav | $221,000 | |
| Closed | Chromy Miroslav | $221,000 | |
| Closed | Chromy Miroslav | $100,800 | |
| Closed | Chromy Miroslav | $25,200 |
Source: Public Records
Tax History Compared to Growth
Tax History
| Year | Tax Paid | Tax Assessment Tax Assessment Total Assessment is a certain percentage of the fair market value that is determined by local assessors to be the total taxable value of land and additions on the property. | Land | Improvement |
|---|---|---|---|---|
| 2025 | $2,643 | $410,113 | $100,000 | $310,113 |
| 2024 | $2,567 | $410,113 | $100,000 | $310,113 |
| 2023 | $2,259 | $287,111 | $38,000 | $249,111 |
| 2022 | $1,427 | $194,803 | $38,000 | $156,803 |
| 2021 | $1,389 | $194,803 | $38,000 | $156,803 |
| 2020 | $1,366 | $194,803 | $38,000 | $156,803 |
| 2019 | $1,179 | $141,918 | $33,000 | $108,918 |
| 2018 | $1,085 | $141,918 | $33,000 | $108,918 |
| 2017 | $1,029 | $141,918 | $33,000 | $108,918 |
| 2016 | $1,008 | $141,918 | $33,000 | $108,918 |
| 2015 | $978 | $137,908 | $34,000 | $103,908 |
| 2014 | -- | $137,908 | $34,000 | $103,908 |
Source: Public Records
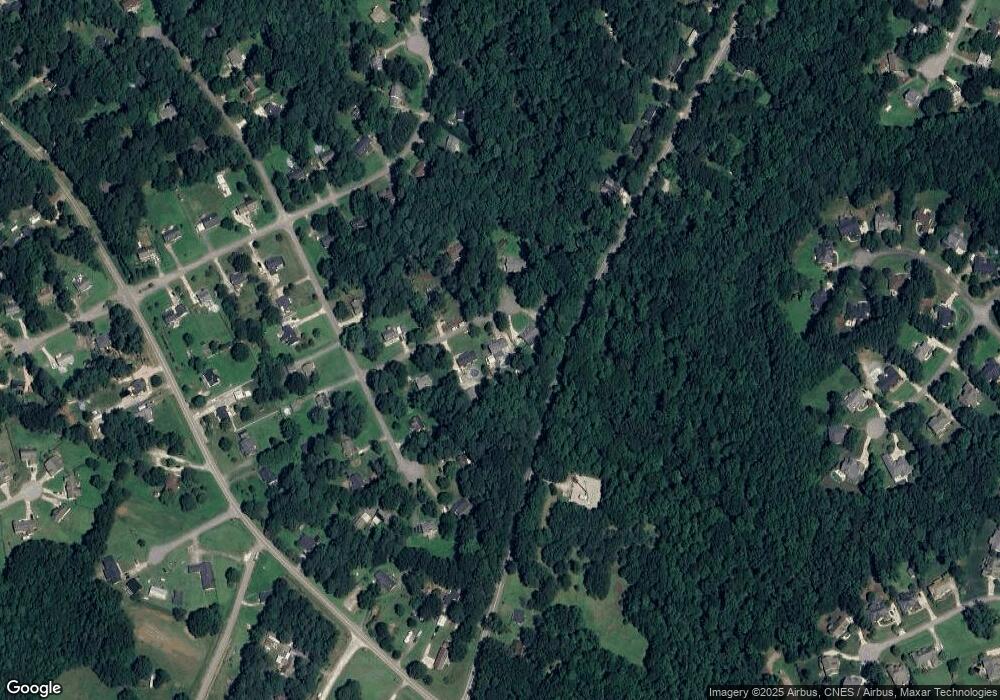
Map
Nearby Homes
- 1200 Misty Morning Way
- 10917 Stage Dr
- 5817 Shedd Dr
- 1017 Widgeon Way
- 2400 Trueway Ln
- 936 Elbridge Dr
- 6024 Lunenburg Dr
- 2817 Buckboard Ln
- 1220 Turner Woods Dr
- 5512 Glenhurst Dr N
- 1508 Middle Ridge Dr
- 1516 Middle Ridge Dr
- 6521 Camellia Creek Dr
- 5216 Relay Way
- 6112 Walnut Glen Dr
- 10329 Fanny Brown Rd
- 1005 Turner Meadow Dr
- 2704 Stageline Dr
- 6308 Walnut Glen Dr
- 1304 Double Oak Ln
- 1013 Oak Twig Dr
- 1001 Oak Twig Dr
- 1004 Oak Twig Dr
- 1012 Oak Twig Dr
- 1017 Oak Twig Dr
- 1008 Oak Twig Dr
- 1016 Oak Twig Dr
- 10921 Bent Branch Dr
- 10925 Bent Branch Dr
- 10909 Bent Branch Dr
- 10929 Bent Branch Dr
- 1029 Southern Oaks Dr
- 10920 Bent Branch Dr
- 10916 Bent Branch Dr
- 10916 Bent Branch Dr Unit L70
- 1025 Southern Oaks Dr
- 10924 Bent Branch Dr
- 10912 Bent Branch Dr
- 1033 Southern Oaks Dr
- 1021 Southern Oaks Dr