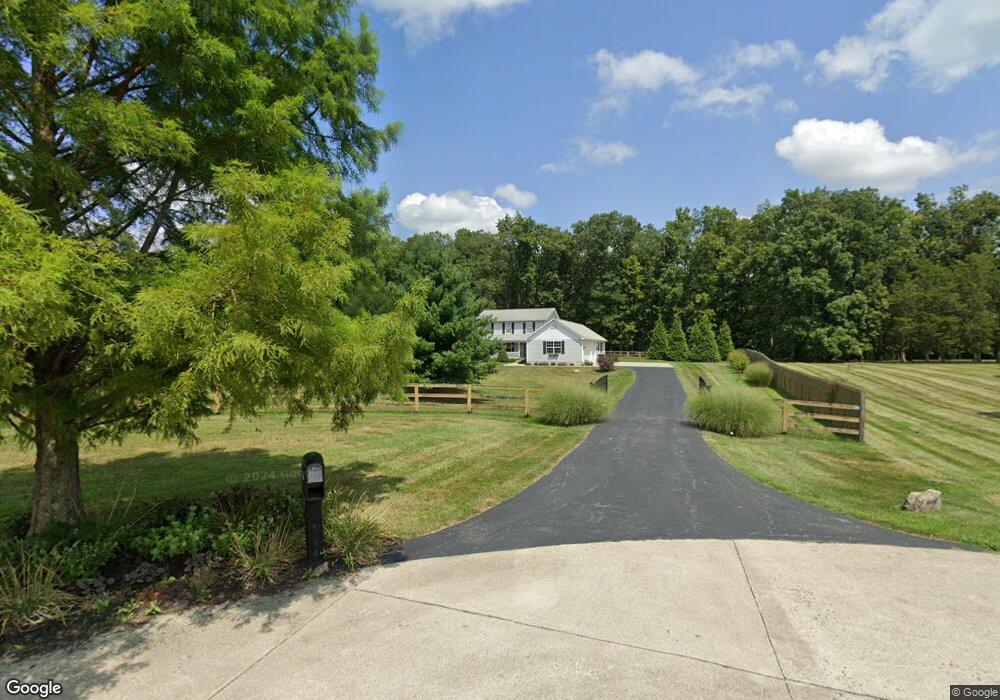
1009 Prestige Way Batavia, OH 45103
Estimated Value: $434,000 - $542,000
3
Beds
3
Baths
2,248
Sq Ft
$214/Sq Ft
Est. Value
About This Home
This home is located at 1009 Prestige Way, Batavia, OH 45103 and is currently estimated at $480,391, approximately $213 per square foot. 1009 Prestige Way is a home located in Clermont County with nearby schools including Clermont Northeastern Elementary School, Clermont Northeastern Middle School, and Clermont Northeastern High School.
Ownership History
Date
Name
Owned For
Owner Type
Purchase Details
Closed on
Dec 28, 2007
Sold by
Schmidt Sharon E and Schmidt Joseph A
Bought by
Nowacki Stanley J
Current Estimated Value
Home Financials for this Owner
Home Financials are based on the most recent Mortgage that was taken out on this home.
Original Mortgage
$238,500
Outstanding Balance
$151,407
Interest Rate
6.27%
Mortgage Type
Purchase Money Mortgage
Estimated Equity
$328,984
Purchase Details
Closed on
Jul 29, 2004
Sold by
Prestige Homes Inc
Bought by
Schmidt Joseph A and Schmidt Sharon E
Home Financials for this Owner
Home Financials are based on the most recent Mortgage that was taken out on this home.
Original Mortgage
$183,000
Interest Rate
6.34%
Mortgage Type
Purchase Money Mortgage
Create a Home Valuation Report for This Property
The Home Valuation Report is an in-depth analysis detailing your home's value as well as a comparison with similar homes in the area
Home Values in the Area
Average Home Value in this Area
Purchase History
| Date | Buyer | Sale Price | Title Company |
|---|---|---|---|
| Nowacki Stanley J | $265,000 | Prodigy Title Agency | |
| Schmidt Joseph A | $362,133 | -- |
Source: Public Records
Mortgage History
| Date | Status | Borrower | Loan Amount |
|---|---|---|---|
| Open | Nowacki Stanley J | $238,500 | |
| Previous Owner | Schmidt Joseph A | $183,000 |
Source: Public Records
Tax History Compared to Growth
Tax History
| Year | Tax Paid | Tax Assessment Tax Assessment Total Assessment is a certain percentage of the fair market value that is determined by local assessors to be the total taxable value of land and additions on the property. | Land | Improvement |
|---|---|---|---|---|
| 2024 | $3,286 | $92,860 | $25,730 | $67,130 |
| 2023 | $3,286 | $92,860 | $25,730 | $67,130 |
| 2022 | $2,719 | $75,750 | $20,970 | $54,780 |
| 2021 | $2,707 | $75,750 | $20,970 | $54,780 |
| 2020 | $2,706 | $75,750 | $20,970 | $54,780 |
| 2019 | $3,040 | $83,690 | $20,720 | $62,970 |
| 2018 | $3,041 | $83,690 | $20,720 | $62,970 |
| 2017 | $2,713 | $83,690 | $20,720 | $62,970 |
| 2016 | $2,713 | $72,770 | $18,030 | $54,740 |
| 2015 | $2,587 | $72,770 | $18,030 | $54,740 |
| 2014 | $2,587 | $72,770 | $18,030 | $54,740 |
| 2013 | $2,767 | $74,200 | $16,870 | $57,330 |
Source: Public Records
Map
Nearby Homes
- 2858 Bigam Rd
- 0 Bigam Rd Unit 1847369
- 2644 Ohio 131
- ac Quitter Rd
- 0 W Main St
- 3294 Ohio 131
- 2943 U S 50
- 5952 Stonelick Creek Ln
- 3270 State Route 131
- 2650 U S 50
- 33 Sutton Ln
- 1750 Parkfield Way
- 2641 U S 50
- 6236 Newtonsville Rd
- 5445 Belle Meade Dr
- 2641 Highway 50
- 6085 Belfast Rd
- 6409 Ohio 727
- 6178 Manila Rd
- 3338 Highway 50
- 1008 Prestige Way
- 3329 Weaver Rd
- 1003 Prestige Way
- 3323 Weaver Rd
- 3347 Weaver Rd
- 3347 Weaver Rd
- 3317 Weaver Rd
- 3313 Weaver Rd
- 1004 Prestige Way
- 3309 Weaver Rd
- 3369 Weaver Rd
- 1000 Prestige Way
- 3307 Weaver Rd
- 3320 Weaver Rd
- 3121 Weaver Rd
- 3328 Weaver Rd
- 5760 Newtonsville Hutchinson Rd
- 5780 Hutchinson Rd
- 5782 Hutchinson Rd
- 5796 Hutchinson Rd