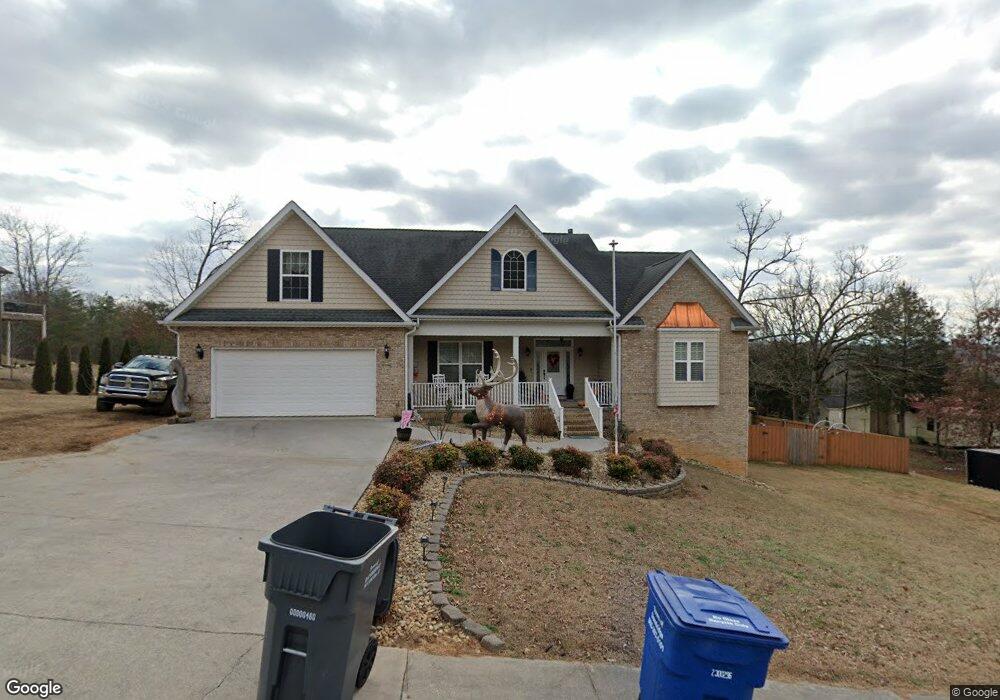
1009 Quail Ridge Ln Unit 1 Dandridge, TN 37725
Estimated Value: $580,000 - $816,000
--
Bed
3
Baths
2,593
Sq Ft
$288/Sq Ft
Est. Value
About This Home
This home is located at 1009 Quail Ridge Ln Unit 1, Dandridge, TN 37725 and is currently estimated at $747,200, approximately $288 per square foot. 1009 Quail Ridge Ln Unit 1 is a home located in Jefferson County with nearby schools including Mountain View Academy For Young Men.
Ownership History
Date
Name
Owned For
Owner Type
Purchase Details
Closed on
Oct 12, 2021
Sold by
Jones Dillon B and Jones Casey J
Bought by
Rackley Robert O
Current Estimated Value
Home Financials for this Owner
Home Financials are based on the most recent Mortgage that was taken out on this home.
Original Mortgage
$522,000
Outstanding Balance
$476,015
Interest Rate
2.8%
Mortgage Type
New Conventional
Estimated Equity
$271,185
Purchase Details
Closed on
Feb 28, 2018
Sold by
Robinson Mary Lou
Bought by
Jones Dillon B and Jones Casey J
Home Financials for this Owner
Home Financials are based on the most recent Mortgage that was taken out on this home.
Original Mortgage
$314,650
Interest Rate
4.04%
Mortgage Type
Unknown
Purchase Details
Closed on
Jul 1, 2005
Sold by
Lindahl Joel E Trustee
Bought by
Robinson Thomas G
Create a Home Valuation Report for This Property
The Home Valuation Report is an in-depth analysis detailing your home's value as well as a comparison with similar homes in the area
Home Values in the Area
Average Home Value in this Area
Purchase History
| Date | Buyer | Sale Price | Title Company |
|---|---|---|---|
| Rackley Robert O | $610,000 | Foothills Title Services Inc | |
| Jones Dillon B | $350,000 | None Available | |
| Robinson Thomas G | $39,900 | -- |
Source: Public Records
Mortgage History
| Date | Status | Borrower | Loan Amount |
|---|---|---|---|
| Open | Rackley Robert O | $522,000 | |
| Previous Owner | Jones Dillon B | $314,650 |
Source: Public Records
Tax History Compared to Growth
Tax History
| Year | Tax Paid | Tax Assessment Tax Assessment Total Assessment is a certain percentage of the fair market value that is determined by local assessors to be the total taxable value of land and additions on the property. | Land | Improvement |
|---|---|---|---|---|
| 2025 | $3,192 | $161,925 | $20,650 | $141,275 |
| 2023 | $3,192 | $99,600 | $0 | $0 |
| 2022 | $3,082 | $99,600 | $11,575 | $88,025 |
| 2021 | $2,586 | $99,600 | $11,575 | $88,025 |
| 2020 | $2,591 | $83,575 | $11,575 | $72,000 |
| 2019 | $2,594 | $83,575 | $11,575 | $72,000 |
| 2018 | $2,776 | $82,875 | $11,575 | $71,300 |
| 2017 | $2,776 | $82,875 | $11,575 | $71,300 |
| 2016 | $2,776 | $82,875 | $11,575 | $71,300 |
| 2015 | $2,775 | $82,875 | $11,575 | $71,300 |
| 2014 | $2,767 | $82,875 | $11,575 | $71,300 |
Source: Public Records
Map
Nearby Homes
- 2041 Majestic Cir
- Lot 80 Serenity Overlook
- 0 Serenity Overlook
- Lot 2 W Main St
- 118 Luxury Ln
- Lot 99 Majestic Cir
- Lot 92R Majestic Cir
- 1476 Martha Dandridge Cir
- Lot 16 Woodland Way
- 660 Armstrong Dr
- 1130 Squirewood Way
- 626 Briarwood Dr
- 625 Armstrong Dr
- 115 Atalaya Dr
- 917 Crickett Dr
- 145 W Meeting St
- 415 Hampton Way
- 888 Isabell Dr
- 1009 Quail Ridge Ln
- P-2-R Quail Ridge Ln
- 9017 Quail Ridge Ln
- 1014 Quail Ridge Ln
- 1007 Quail Ridge Ln
- Lot 23 Harbor Ridge Ln
- 937 E Cross Rd
- UNIT406 Hwy 139
- Hwy 139 Tennessee 139
- 400 W Main St
- 2 Morningside Dr
- 1016 Quail Ridge Ln
- 12 Tennessee 139 Unit 103
- P 023.02/023 Tennessee 139
- LOT #2 Tennessee 139
- 0000 Tennessee 139
- 990 Tennessee 139
- 105 Morningside Ln
- 105 Morning Side Ln
- 917 E Cross Rd