Estimated Value: $235,000 - $285,000
3
Beds
2
Baths
1,898
Sq Ft
$136/Sq Ft
Est. Value
About This Home
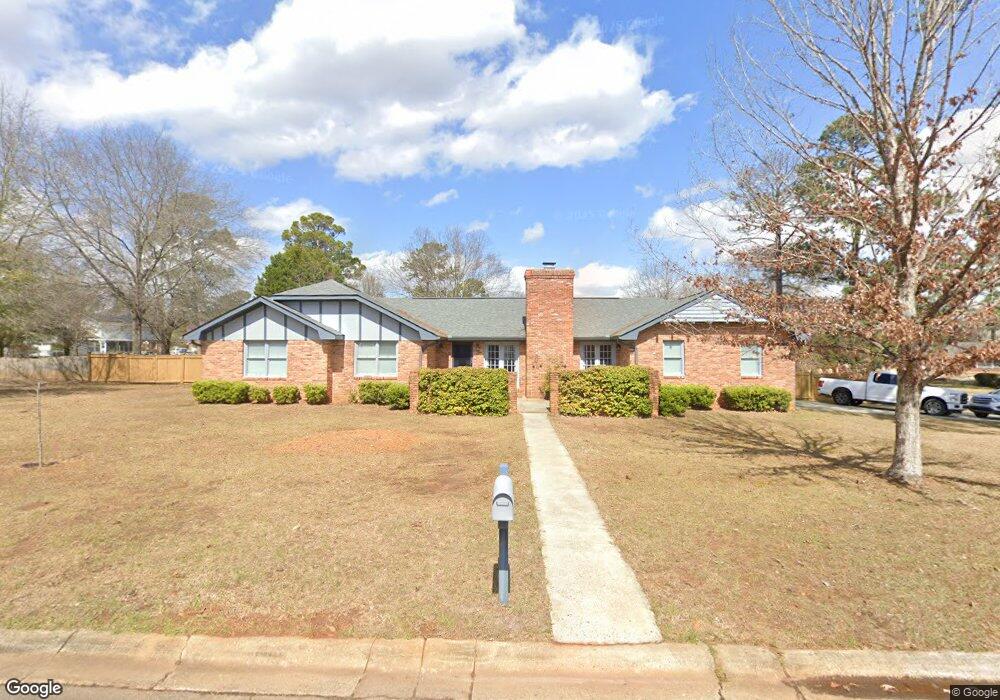
This home is located at 1009 Ridge Cir S, Perry, GA 31069 and is currently estimated at $258,408, approximately $136 per square foot. 1009 Ridge Cir S is a home located in Houston County with nearby schools including Morningside Elementary School, Perry Middle School, and Perry High School.
Ownership History
Date
Name
Owned For
Owner Type
Purchase Details
Closed on
Jan 17, 2012
Sold by
Sellers Andrea G
Bought by
Sellers Richard F
Current Estimated Value
Purchase Details
Closed on
Oct 18, 1993
Sold by
George Randy L and Tammy L*
Bought by
Sellers Richard F and Andrea G*
Purchase Details
Closed on
Jul 29, 1988
Sold by
Rice Alfred F and Erma L*
Bought by
George Randy L and Tammy L*
Purchase Details
Closed on
Jul 14, 1980
Sold by
Peel Edward and Peel Elaine C
Bought by
Rice Alfred F and Erma L*
Purchase Details
Closed on
Apr 6, 1979
Sold by
Peel Edward
Bought by
Peel Edward and Peel Elaine C
Purchase Details
Closed on
Mar 14, 1979
Sold by
Cagle George N
Bought by
Peel Edward
Purchase Details
Closed on
Aug 1, 1977
Sold by
Sandifer Jack H and Sandifer Meral O
Bought by
Cagle George N
Purchase Details
Closed on
Jun 30, 1975
Sold by
Sandifer Jack H
Bought by
Sandifer Jack H and Sandifer Meral O
Purchase Details
Closed on
May 14, 1975
Sold by
Koplin Co
Bought by
Sandifer Jack H
Create a Home Valuation Report for This Property
The Home Valuation Report is an in-depth analysis detailing your home's value as well as a comparison with similar homes in the area
Home Values in the Area
Average Home Value in this Area
Purchase History
| Date | Buyer | Sale Price | Title Company |
|---|---|---|---|
| Sellers Richard F | -- | -- | |
| Sellers Richard F | $89,000 | -- | |
| George Randy L | -- | -- | |
| Rice Alfred F | -- | -- | |
| Peel Edward | -- | -- | |
| Peel Edward | -- | -- | |
| Cagle George N | -- | -- | |
| Sandifer Jack H | -- | -- | |
| Sandifer Jack H | -- | -- |
Source: Public Records
Tax History Compared to Growth
Tax History
| Year | Tax Paid | Tax Assessment Tax Assessment Total Assessment is a certain percentage of the fair market value that is determined by local assessors to be the total taxable value of land and additions on the property. | Land | Improvement |
|---|---|---|---|---|
| 2024 | $3,013 | $83,240 | $10,000 | $73,240 |
| 2023 | $2,459 | $67,720 | $10,000 | $57,720 |
| 2022 | $1,389 | $62,400 | $10,000 | $52,400 |
| 2021 | $1,222 | $54,880 | $10,000 | $44,880 |
| 2020 | $1,174 | $52,520 | $10,000 | $42,520 |
| 2019 | $1,174 | $52,520 | $10,000 | $42,520 |
| 2018 | $1,174 | $52,520 | $10,000 | $42,520 |
| 2017 | $1,175 | $52,520 | $10,000 | $42,520 |
| 2016 | $1,177 | $52,520 | $10,000 | $42,520 |
| 2015 | $1,179 | $52,520 | $10,000 | $42,520 |
| 2014 | -- | $52,520 | $10,000 | $42,520 |
| 2013 | -- | $52,520 | $10,000 | $42,520 |
Source: Public Records
Map
Nearby Homes
- 1008 Ridge Cir S
- 1402 Park Ave
- 108 Christine Cir
- 113 Flat Rock Ln
- 100 Flat Rock Ln
- 500 Legacy Park Dr
- 311 Rusty Plow Ln Unit 16
- 307 Rusty Plow Ln
- 104 Red Barn Ct
- 102 Kanza Trail
- 307 Rusty Plow Ln Unit 14
- 0 Perimeter Roads Unit 20145464
- 110 Gwendolyn Ave
- 412 Legacy Park Dr
- The Pearson Plan at Avalon
- The Crawford Plan at Avalon
- The Piedmont Plan at Avalon
- The McGinnis Plan at Avalon
- The Coleman Plan at Avalon
- The Lawson Plan at Avalon
- 101 Valley Ridge Dr
- 1007 Ridge Cir S
- 1005 Ridge Cir S
- 1104 Ridge Cir S
- 1102 Ridge Cir S
- 1106 Ridge Cir S
- 103 Valley Ridge Dr
- 1101 Ridge Cir S
- 1003 Ridge Cir S
- 102 Valley Ridge Dr
- 1108 Ridge Cir S
- 1100 Ridge Cir S
- 1001 Ridge Cir S
- 105 Valley Ridge Dr
- 1110 Ridge Cir S
- 100 Ridge Cir N
- 1101 Pineneedle Dr
- 1105 Pineneedle Dr
- 1010 Ridge Cir S
- 102 Ridge Cir N