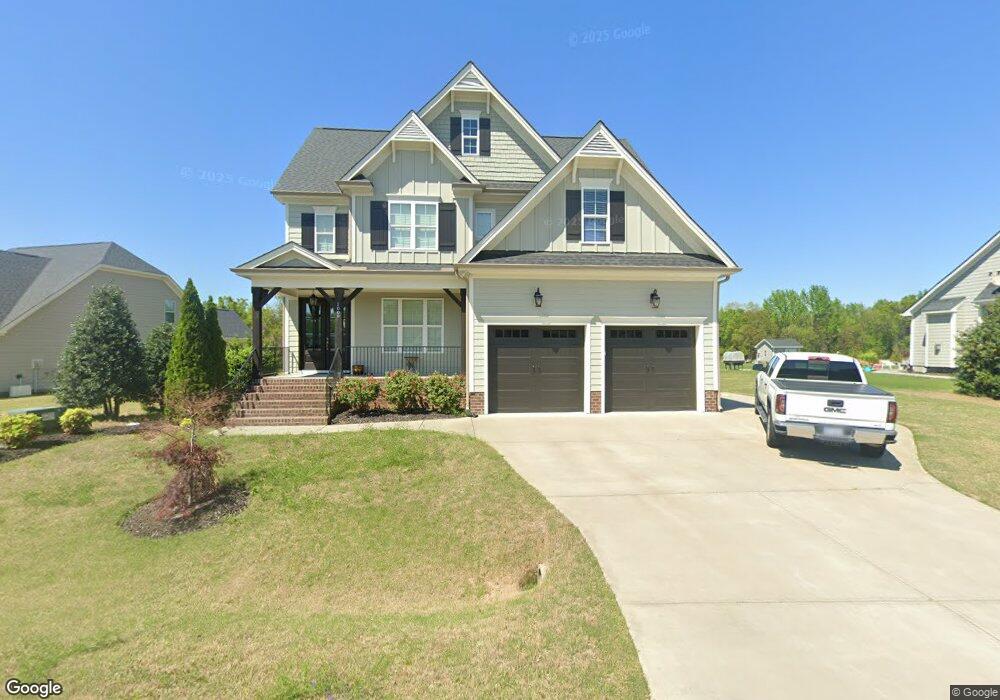
1009 Sky Wave Trail Unit 2 Raleigh, NC 27603
Estimated Value: $567,000 - $630,000
4
Beds
3
Baths
2,707
Sq Ft
$219/Sq Ft
Est. Value
About This Home
This home is located at 1009 Sky Wave Trail Unit 2, Raleigh, NC 27603 and is currently estimated at $594,165, approximately $219 per square foot. 1009 Sky Wave Trail Unit 2 is a home located in Wake County with nearby schools including Aversboro Elementary, East Garner Middle School, and South Garner High.
Ownership History
Date
Name
Owned For
Owner Type
Purchase Details
Closed on
Nov 15, 2021
Sold by
Shaban Matthew Garrett and Newlon Kendra Ann
Bought by
Perry Max Lee and Perry Nicole Baker
Current Estimated Value
Home Financials for this Owner
Home Financials are based on the most recent Mortgage that was taken out on this home.
Original Mortgage
$420,000
Outstanding Balance
$385,177
Interest Rate
3.05%
Mortgage Type
New Conventional
Estimated Equity
$208,988
Purchase Details
Closed on
Sep 13, 2016
Sold by
Sage Built Llc
Bought by
Shaban Matthew Garrett and Newlon Kendra Ann
Home Financials for this Owner
Home Financials are based on the most recent Mortgage that was taken out on this home.
Original Mortgage
$341,010
Interest Rate
3.45%
Mortgage Type
New Conventional
Purchase Details
Closed on
Mar 2, 2016
Sold by
Cohiba Llc
Bought by
Sage Built Llc
Create a Home Valuation Report for This Property
The Home Valuation Report is an in-depth analysis detailing your home's value as well as a comparison with similar homes in the area
Home Values in the Area
Average Home Value in this Area
Purchase History
| Date | Buyer | Sale Price | Title Company |
|---|---|---|---|
| Perry Max Lee | $525,000 | None Available | |
| Shaban Matthew Garrett | $379,000 | None Available | |
| Sage Built Llc | $68,000 | None Available |
Source: Public Records
Mortgage History
| Date | Status | Borrower | Loan Amount |
|---|---|---|---|
| Open | Perry Max Lee | $420,000 | |
| Previous Owner | Shaban Matthew Garrett | $341,010 |
Source: Public Records
Tax History Compared to Growth
Tax History
| Year | Tax Paid | Tax Assessment Tax Assessment Total Assessment is a certain percentage of the fair market value that is determined by local assessors to be the total taxable value of land and additions on the property. | Land | Improvement |
|---|---|---|---|---|
| 2025 | $3,208 | $498,467 | $75,000 | $423,467 |
| 2024 | $3,115 | $498,467 | $75,000 | $423,467 |
| 2023 | $2,952 | $376,002 | $53,500 | $322,502 |
| 2022 | $2,735 | $376,002 | $53,500 | $322,502 |
| 2021 | $2,662 | $376,002 | $53,500 | $322,502 |
| 2020 | $2,618 | $376,002 | $53,500 | $322,502 |
| 2019 | $2,971 | $361,390 | $68,000 | $293,390 |
| 2018 | $2,732 | $361,390 | $68,000 | $293,390 |
| 2017 | $2,589 | $361,390 | $68,000 | $293,390 |
| 2016 | $474 | $40,000 | $40,000 | $0 |
Source: Public Records
Map
Nearby Homes
- 9017 Hunterfox Ct
- 10001 Joe Leach Rd
- 1559 Upchurch Woods Dr
- 9505 Neils Branch Rd
- 1004 Cabin Hill Way
- 1004 Snow Peak Ct
- 920 Shadywood Ln
- 5521 Fantasy Moth Dr
- 1116 Shadywood Ln
- 1101 Robinfield Dr
- 107 Bull Bay Ln
- 5013 Contender Dr
- 6109 Oak Passage Dr
- 139 Bull Bay Ln
- 135 Bull Bay Ln
- 221 Sprenger St
- 229 Sprenger St
- 233 Sprenger St
- 941 Grand Mesa Dr
- 937 Grand Mesa Dr
- 1009 Sky Wave Trail
- 1013 Sky Wave Trail Unit 3
- 1013 Sky Wave Trail
- 1001 Sky Wave Trail
- 1017 Sky Wave Trail Unit 4
- 1012 Sky Wave Trail
- 1004 Sky Wave Trail Unit 44
- 5401 Whistling Duck Ct
- 1021 Sky Wave Trail Unit 5
- 1000 Sky Wave Trail
- 1016 Sky Wave Trail Unit 31
- 10008 Jordan Rd
- 1020 Sky Wave Trail
- 1025 Sky Wave Trail Unit 6
- 1433 Roy Averette Dr
- 1444 Guffy Dr
- 1024 Sky Wave Trail
- 5404 Whistling Duck Ct
- 1440 Guffy Dr
- 5520 Red Line Ct Unit 21