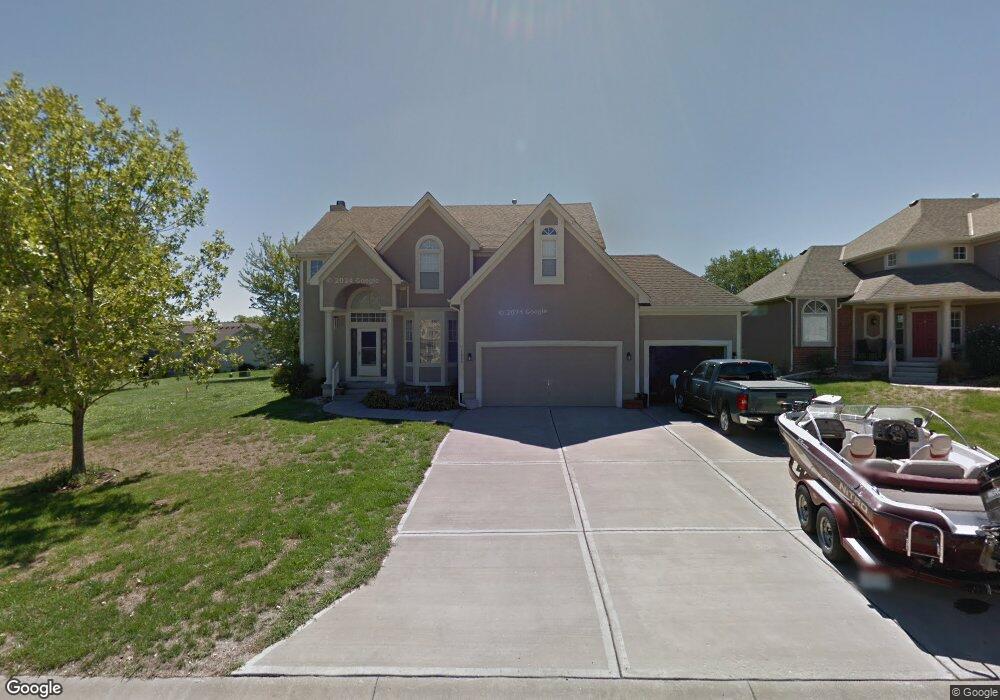
1009 SW Whistle Dr Lees Summit, MO 64082
Estimated Value: $455,163 - $494,000
4
Beds
4
Baths
2,204
Sq Ft
$215/Sq Ft
Est. Value
About This Home
This home is located at 1009 SW Whistle Dr, Lees Summit, MO 64082 and is currently estimated at $473,541, approximately $214 per square foot. 1009 SW Whistle Dr is a home located in Jackson County with nearby schools including Summit Pointe Elementary School, Summit Lakes Middle School, and Lee's Summit West High School.
Ownership History
Date
Name
Owned For
Owner Type
Purchase Details
Closed on
Jan 31, 2008
Sold by
Boline Kevin T and Boline Sarah
Bought by
Elder Robert and Elder Karen
Current Estimated Value
Home Financials for this Owner
Home Financials are based on the most recent Mortgage that was taken out on this home.
Original Mortgage
$211,500
Outstanding Balance
$134,035
Interest Rate
6.15%
Mortgage Type
Purchase Money Mortgage
Estimated Equity
$339,506
Purchase Details
Closed on
Nov 23, 2005
Sold by
Mcgovern Builders Inc
Bought by
Boline Kevin T
Home Financials for this Owner
Home Financials are based on the most recent Mortgage that was taken out on this home.
Original Mortgage
$218,237
Interest Rate
6.06%
Mortgage Type
Fannie Mae Freddie Mac
Purchase Details
Closed on
Sep 9, 2004
Sold by
Stoney Creek Development Llc
Bought by
Mcgovern Builders Inc
Home Financials for this Owner
Home Financials are based on the most recent Mortgage that was taken out on this home.
Original Mortgage
$201,754
Interest Rate
5.81%
Mortgage Type
Construction
Create a Home Valuation Report for This Property
The Home Valuation Report is an in-depth analysis detailing your home's value as well as a comparison with similar homes in the area
Home Values in the Area
Average Home Value in this Area
Purchase History
| Date | Buyer | Sale Price | Title Company |
|---|---|---|---|
| Elder Robert | -- | Kansas City Title | |
| Boline Kevin T | -- | Coffelt Land Title Inc | |
| Mcgovern Builders Inc | -- | Coffelt Land Title Inc |
Source: Public Records
Mortgage History
| Date | Status | Borrower | Loan Amount |
|---|---|---|---|
| Open | Elder Robert | $211,500 | |
| Previous Owner | Boline Kevin T | $218,237 | |
| Previous Owner | Mcgovern Builders Inc | $201,754 |
Source: Public Records
Tax History Compared to Growth
Tax History
| Year | Tax Paid | Tax Assessment Tax Assessment Total Assessment is a certain percentage of the fair market value that is determined by local assessors to be the total taxable value of land and additions on the property. | Land | Improvement |
|---|---|---|---|---|
| 2025 | $5,495 | $77,643 | $15,116 | $62,527 |
| 2024 | $5,455 | $76,106 | $12,586 | $63,520 |
| 2023 | $5,455 | $76,106 | $11,664 | $64,442 |
| 2022 | $4,739 | $58,710 | $6,973 | $51,737 |
| 2021 | $4,837 | $58,710 | $6,973 | $51,737 |
| 2020 | $4,657 | $55,966 | $6,973 | $48,993 |
| 2019 | $4,530 | $55,966 | $6,973 | $48,993 |
| 2018 | $1,631,779 | $48,709 | $6,069 | $42,640 |
| 2017 | $4,248 | $48,709 | $6,069 | $42,640 |
| 2016 | $4,113 | $46,683 | $7,961 | $38,722 |
| 2014 | $4,033 | $44,874 | $7,448 | $37,426 |
Source: Public Records
Map
Nearby Homes
- 4400 SW Rivulet Dr
- 1022 SW Cheshire Dr
- 4605 SW Olympia Cir
- 4120 SW Flintrock Dr
- 3923 SW Ward Rd
- 1021 SW Cheshire Dr
- 4104 SW Flintrock Dr
- 4520 SW Berkshire Dr
- 4528 SW Berkshire Dr
- 4510 SW Fenwick Rd
- Serenade Plan at Stoney Creek - Bliss Collection
- Oasis Plan at Stoney Creek - Bliss Collection
- Devotion Plan at Stoney Creek - Bliss Collection
- Brookside Plan at Stoney Creek - Premier Collection
- Serenity Plan at Stoney Creek - Bliss Collection
- Avalon Plan at Stoney Creek - Premier Collection
- Harmony Plan at Stoney Creek - Bliss Collection
- 1937 SW Merryman Dr
- Lexington Plan at Stoney Creek - Premier Collection
- Crestwood Plan at Stoney Creek - Premier Collection
- 1013 SW Whistle Dr
- 1008 SW Whistle Dr
- 1012 SW Whistle Dr
- 1005 SW Whistle Dr
- 1017 SW Whistle Dr
- 4400 SW Hillside Dr
- 1016 SW Whistle Dr
- 1001 SW Whistle Dr
- 1004 SW Whistle Dr
- 1000 SW Whistle Dr
- 1021 SW Whistle Dr
- 4401 SW Hillside Dr
- 1020 SW Whistle Dr
- 4404 SW Hillside Dr
- 4403 SW Rivulet Dr
- 4405 SW Hillside Dr
- 1025 SW Whistle Dr
- 4407 SW Rivulet Dr
- 1009 SW Drake Cir
- 4408 SW Hillside Dr