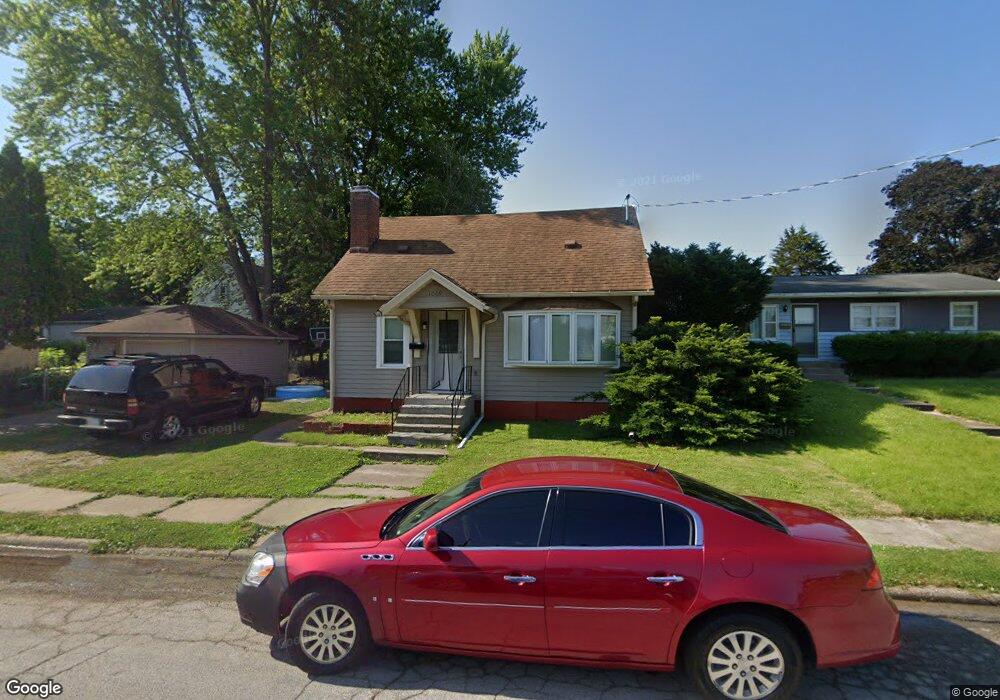
1009 W 10th St Davenport, IA 52804
Central Davenport NeighborhoodEstimated Value: $44,000 - $136,000
3
Beds
2
Baths
1,196
Sq Ft
$86/Sq Ft
Est. Value
About This Home
This home is located at 1009 W 10th St, Davenport, IA 52804 and is currently estimated at $103,449, approximately $86 per square foot. 1009 W 10th St is a home located in Scott County with nearby schools including Walnut Hill Elementary School, Christian County Middle School, and Casey County Middle School.
Ownership History
Date
Name
Owned For
Owner Type
Purchase Details
Closed on
Oct 31, 2019
Sold by
Quiet Capital Llc
Bought by
Saphan Investment Llc
Current Estimated Value
Purchase Details
Closed on
Feb 26, 2019
Sold by
Bank Of America Na
Bought by
Happy Heart Properties
Purchase Details
Closed on
Jan 29, 2010
Sold by
Adair Holdings Llc
Bought by
Long Nathan E
Purchase Details
Closed on
Sep 17, 2009
Sold by
Long Nathan E and Massingill Jesse
Bought by
Adair Holdings Llc
Create a Home Valuation Report for This Property
The Home Valuation Report is an in-depth analysis detailing your home's value as well as a comparison with similar homes in the area
Home Values in the Area
Average Home Value in this Area
Purchase History
| Date | Buyer | Sale Price | Title Company |
|---|---|---|---|
| Saphan Investment Llc | $90,000 | -- | |
| Happy Heart Properties | $32,600 | -- | |
| Long Nathan E | $1,500 | None Available | |
| Adair Holdings Llc | -- | None Available |
Source: Public Records
Tax History Compared to Growth
Tax History
| Year | Tax Paid | Tax Assessment Tax Assessment Total Assessment is a certain percentage of the fair market value that is determined by local assessors to be the total taxable value of land and additions on the property. | Land | Improvement |
|---|---|---|---|---|
| 2025 | $1,600 | $83,420 | $16,350 | $67,070 |
| 2024 | $1,751 | $89,520 | $16,350 | $73,170 |
| 2023 | $1,598 | $89,520 | $16,350 | $73,170 |
| 2022 | $1,654 | $74,800 | $8,050 | $66,750 |
| 2021 | $1,606 | $74,800 | $8,050 | $66,750 |
| 2020 | $1,561 | $65,750 | $8,050 | $57,700 |
| 2019 | $1,662 | $63,240 | $8,050 | $55,190 |
| 2018 | $986 | $63,240 | $8,050 | $55,190 |
| 2017 | $337 | $60,530 | $8,050 | $52,480 |
| 2016 | $1,404 | $56,740 | $0 | $0 |
| 2015 | $1,242 | $49,100 | $0 | $0 |
| 2014 | $1,090 | $49,100 | $0 | $0 |
| 2013 | $1,072 | $0 | $0 | $0 |
| 2012 | -- | $47,070 | $8,950 | $38,120 |
Source: Public Records
Map
Nearby Homes