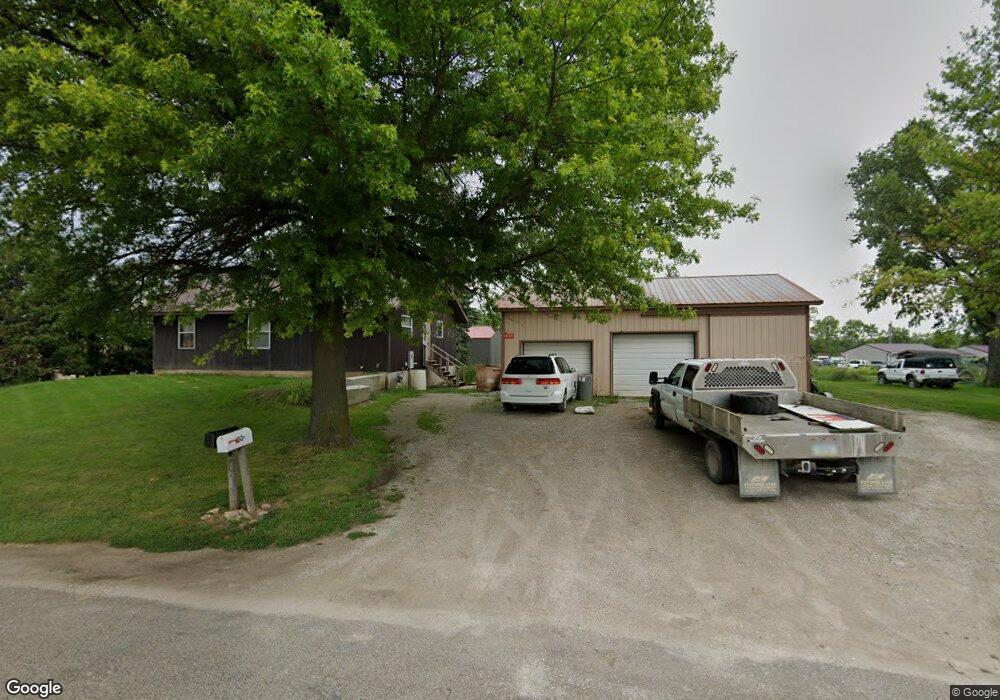
1009 W 1st St Vinton, IA 52349
Estimated Value: $217,000 - $237,000
3
Beds
4
Baths
1,200
Sq Ft
$189/Sq Ft
Est. Value
About This Home
This home is located at 1009 W 1st St, Vinton, IA 52349 and is currently estimated at $227,123, approximately $189 per square foot. 1009 W 1st St is a home located in Benton County with nearby schools including Tilford Elementary School, Shellsburg Elementary School, and Vinton-Shellsburg Middle School.
Ownership History
Date
Name
Owned For
Owner Type
Purchase Details
Closed on
Aug 4, 2025
Sold by
Merchant Marcus C
Bought by
Heidt David
Current Estimated Value
Home Financials for this Owner
Home Financials are based on the most recent Mortgage that was taken out on this home.
Original Mortgage
$39,100
Outstanding Balance
$36,595
Interest Rate
6.77%
Mortgage Type
New Conventional
Estimated Equity
$190,528
Purchase Details
Closed on
Oct 26, 2012
Sold by
Garrett Jeanne Marie and Merchant Jeanne Marie
Bought by
Merchant Marcus A
Create a Home Valuation Report for This Property
The Home Valuation Report is an in-depth analysis detailing your home's value as well as a comparison with similar homes in the area
Home Values in the Area
Average Home Value in this Area
Purchase History
| Date | Buyer | Sale Price | Title Company |
|---|---|---|---|
| Heidt David | $230,000 | None Listed On Document | |
| Merchant Marcus A | -- | None Available |
Source: Public Records
Mortgage History
| Date | Status | Borrower | Loan Amount |
|---|---|---|---|
| Open | Heidt David | $39,100 | |
| Open | Heidt David | $184,000 |
Source: Public Records
Tax History Compared to Growth
Tax History
| Year | Tax Paid | Tax Assessment Tax Assessment Total Assessment is a certain percentage of the fair market value that is determined by local assessors to be the total taxable value of land and additions on the property. | Land | Improvement |
|---|---|---|---|---|
| 2025 | $2,514 | $156,700 | $27,000 | $129,700 |
| 2024 | $2,514 | $144,400 | $26,300 | $118,100 |
| 2023 | $2,398 | $144,400 | $26,300 | $118,100 |
| 2022 | $2,460 | $120,300 | $21,100 | $99,200 |
| 2021 | $2,460 | $120,300 | $21,100 | $99,200 |
| 2020 | $2,502 | $126,800 | $24,600 | $102,200 |
| 2019 | $2,522 | $124,400 | $24,600 | $99,800 |
| 2018 | $2,446 | $123,600 | $22,600 | $101,000 |
| 2017 | $2,346 | $123,600 | $22,600 | $101,000 |
| 2016 | $2,304 | $115,500 | $21,100 | $94,400 |
| 2015 | $2,304 | $115,500 | $21,100 | $94,400 |
| 2014 | $2,244 | $62,300 | $0 | $0 |
Source: Public Records
Map
Nearby Homes