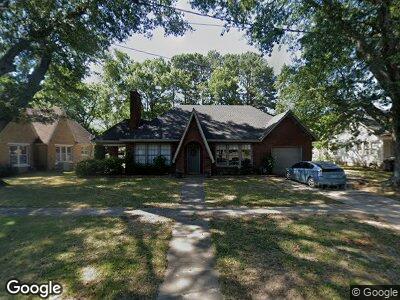
1009 W Arch Ave Searcy, AR 72143
Estimated Value: $155,638 - $183,000
--
Bed
2
Baths
1,440
Sq Ft
$117/Sq Ft
Est. Value
About This Home
This home is located at 1009 W Arch Ave, Searcy, AR 72143 and is currently estimated at $168,410, approximately $116 per square foot. 1009 W Arch Ave is a home located in White County with nearby schools including Southwest Middle School, McRae Elementary School, and Ahlf Junior High School.
Ownership History
Date
Name
Owned For
Owner Type
Purchase Details
Closed on
Dec 21, 2020
Sold by
Shaw Jimmy C and Shaw Angela R
Bought by
Greek Stephen Lee and Greek Claudia Lee
Current Estimated Value
Home Financials for this Owner
Home Financials are based on the most recent Mortgage that was taken out on this home.
Original Mortgage
$96,000
Outstanding Balance
$86,642
Interest Rate
2.7%
Mortgage Type
New Conventional
Estimated Equity
$77,771
Purchase Details
Closed on
Apr 29, 2005
Sold by
Tucker John and Tucker Laura E
Bought by
Shaw Jimmy C and Shaw Angela R
Home Financials for this Owner
Home Financials are based on the most recent Mortgage that was taken out on this home.
Original Mortgage
$80,000
Interest Rate
5.93%
Mortgage Type
Future Advance Clause Open End Mortgage
Purchase Details
Closed on
Jun 7, 2002
Bought by
Tucker John and Tucker Laura E
Purchase Details
Closed on
Jan 1, 1995
Bought by
Davis Jeffry B and Davis Jennifer
Create a Home Valuation Report for This Property
The Home Valuation Report is an in-depth analysis detailing your home's value as well as a comparison with similar homes in the area
Home Values in the Area
Average Home Value in this Area
Purchase History
| Date | Buyer | Sale Price | Title Company |
|---|---|---|---|
| Greek Stephen Lee | $120,000 | Dalco Closing & Title | |
| Shaw Jimmy C | $116,000 | None Available | |
| Tucker John | $113,000 | -- | |
| Davis Jeffry B | $72,000 | -- |
Source: Public Records
Mortgage History
| Date | Status | Borrower | Loan Amount |
|---|---|---|---|
| Open | Greek Stephen Lee | $96,000 | |
| Previous Owner | Shaw Jimmy C | $73,659 | |
| Previous Owner | Shaw Jimmy C | $83,000 | |
| Previous Owner | Shaw Jimmy C | $80,000 |
Source: Public Records
Tax History Compared to Growth
Tax History
| Year | Tax Paid | Tax Assessment Tax Assessment Total Assessment is a certain percentage of the fair market value that is determined by local assessors to be the total taxable value of land and additions on the property. | Land | Improvement |
|---|---|---|---|---|
| 2024 | $765 | $18,830 | $1,540 | $17,290 |
| 2023 | $340 | $18,830 | $1,540 | $17,290 |
| 2022 | $390 | $18,830 | $1,540 | $17,290 |
| 2021 | $390 | $18,830 | $1,540 | $17,290 |
| 2020 | $380 | $18,590 | $1,510 | $17,080 |
| 2019 | $380 | $18,590 | $1,510 | $17,080 |
| 2018 | $405 | $18,590 | $1,510 | $17,080 |
| 2017 | $755 | $18,590 | $1,510 | $17,080 |
| 2016 | $755 | $18,590 | $1,510 | $17,080 |
| 2015 | $808 | $19,910 | $2,420 | $17,490 |
| 2014 | $775 | $19,080 | $2,420 | $16,660 |
Source: Public Records
Map
Nearby Homes
- 1009 W Arch Ave
- 1007 W Arch Ave
- 1005 W Arch Ave
- 1107 W Arch Ave
- 1100 W Arch Ave
- 106 N Sowell St
- 1008 W Arch Ave
- 1006 W Arch Ave
- 1008 W Center Ave
- 1004 W Arch Ave Unit 1006
- 1014 W Center Ave
- 1106 W Center Ave
- 1001 1/2 W Arch Ave
- 1001 W Arch Ave
- 1010 W Center Ave
- 1106 W Arch Ave
- 1108 W Center Ave
- 1110 W Center Ave
- 1009 W Race Ave
- 1201 W Arch Ave