NOT LISTED FOR SALE

100A 29th St S Brigantine, NJ 08203

Estimated Value: $1,057,000 - $1,293,000

-- Bed
-- Bath
3,086 Sq Ft
$372/Sq Ft Est. Value

About This Home

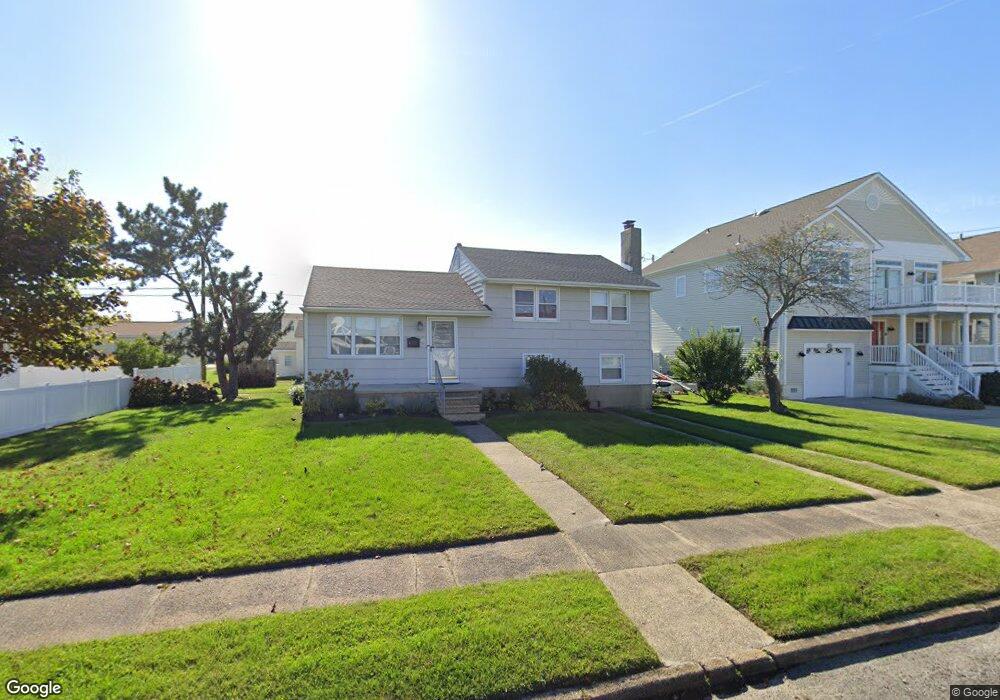
This home is located at 100A 29th St S, Brigantine, NJ 08203 and is currently estimated at $1,148,377, approximately $372 per square foot. 100A 29th St S is a home located in Atlantic County with nearby schools including Brigantine Elementary School and Brigantine Community School.

Ownership History

Date Name Owned For Owner Type

Purchase Details

Closed on
Nov 2, 2018
Sold by
Davis Kathleen K
Bought by
Michalowski Kathleen Kelley and Kathleen K Davis Family Trust
Current Estimated Value
$1,148,377

Purchase Details

Closed on
Apr 16, 2004
Sold by
Mcferren Dwayne and Hannah Ernest Brian
Bought by
Davis Francis R and Davis Kathleen K

Home Financials for this Owner

Home Financials are based on the most recent Mortgage that was taken out on this home.
Original Mortgage
$333,700
Interest Rate
5.58%
Mortgage Type
Purchase Money Mortgage

Purchase Details

Closed on
Feb 20, 2003
Sold by
Darpino Grace
Bought by
Mcferren Dwayne Mc and Hannah Ernest

Home Financials for this Owner

Home Financials are based on the most recent Mortgage that was taken out on this home.
Original Mortgage
$0
Interest Rate
5.9%
Mortgage Type
Credit Line Revolving

Purchase Details

Closed on
Sep 24, 2002
Sold by
Shopf Audrey L
Bought by
Darpino Grace

Range of Values:

Collateral Analytics

Collateral Analytics Collateral Analytics AVMs (Automated Valuation Model) employ a number of statistical approaches combined with neighborhood-specific comparable selection guarantees the most up-to-date and precise valuations.

Not Available

Collateral Analytics does not have data for the current month. Please view the chart for historical values.

ICE

ICE Mortgage Technology ICE Mortgage Technology’s AVM (Automated Valuation Model) is a state-of-the-art online residential property valuation tool that provides a quick and accurate estimate of the value of almost any home in the U.S.

Not Available

ICE Mortgage Technology does not have data for the current month. Please view the chart for historical values.

First American

First American First American Data & Analytics’ next-generation AVM combines unrivaled data assets with a blended ensemble of valuation models to produce highly accurate, reliable valuations you can trust.

Not Available

First American does not have data for the current month. Please view the chart for historical values.

Quantarium

Quantarium Quantarium’s valuation service, repeatedly proven the industry’s most accurate and comprehensive, is supercharged with a self-learning and auto-tuning AI engine that continually becomes smarter and more accurate as it processes daily inputs from the industry’s leading RE data lake.

Not Available

Quantarium does not have data for the current month. Please view the chart for historical values.

Average Value
Not Available
List Price
Sold Price
Create a Home Valuation Report for This Property
The Home Valuation Report is an in-depth analysis detailing your home's value as well as a comparison with similar homes in the area

Home Values in the Area

Source: Public Records

Average Home Value in this Area


Source: Public Records

Purchase History

Date Buyer Sale Price Title Company
Michalowski Kathleen Kelley -- None Available
Davis Francis R $650,000 Commonwealth Title
Mcferren Dwayne Mc $255,000 --
Mcferren Dwayne $255,000 Commonwealth Land Title Ins
Darpino Grace $150,000 Commonwealth Land Title Ins
Source: Public Records

Mortgage History

Date Status Borrower Loan Amount
Open Davis Francis R $417,000
Closed Davis Francis R $322,324
Closed Davis Francis R $333,700
Previous Owner Mcferren Dwayne $0
Previous Owner Mcferren Dwayne $347,520
Source: Public Records

Tax History Compared to Growth

Source: Public Records

Tax History

Year Tax Paid Tax Assessment Tax Assessment Total Assessment is a certain percentage of the fair market value that is determined by local assessors to be the total taxable value of land and additions on the property. Land Improvement
2024 $10,603 $564,000 $212,800 $351,200
2023 $9,797 $564,000 $212,800 $351,200
2022 $9,797 $564,000 $212,800 $351,200
2021 $9,622 $564,000 $212,800 $351,200
2020 $9,520 $564,000 $212,800 $351,200
2019 $9,605 $564,000 $212,800 $351,200
2018 $9,797 $564,000 $212,800 $351,200
2017 $9,955 $564,000 $212,800 $351,200
2016 $9,949 $564,000 $212,800 $351,200
2015 $10,000 $564,000 $212,800 $351,200
2014 $9,627 $564,000 $212,800 $351,200
Source: Public Records

Map