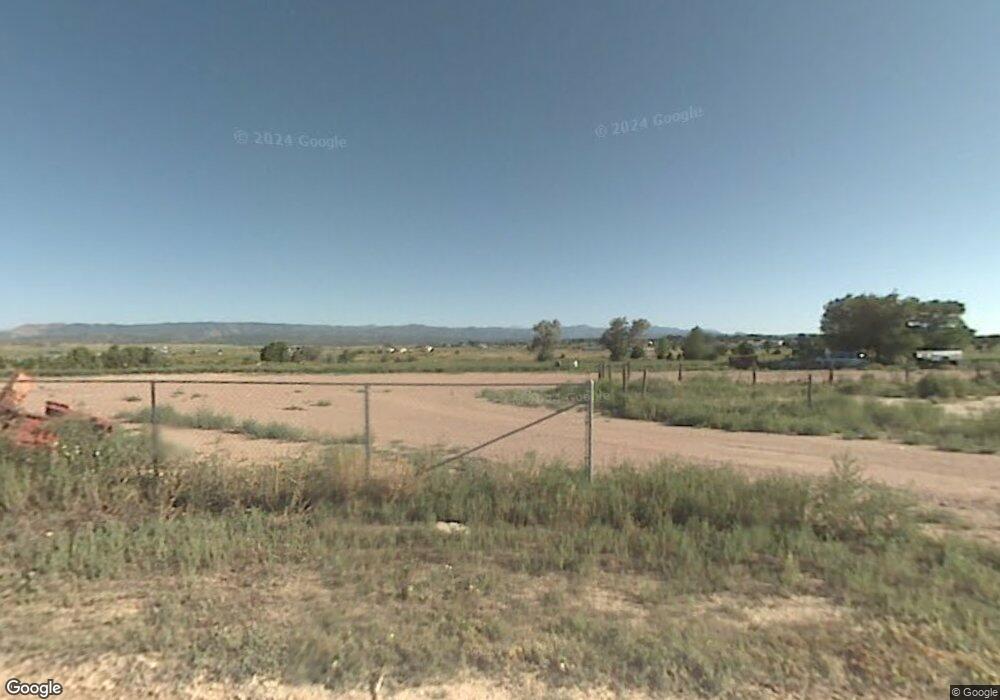
101 10th St Penrose, CO 81240
Estimated Value: $366,000 - $1,176,000
--
Bed
--
Bath
7,500
Sq Ft
$81/Sq Ft
Est. Value
About This Home
This home is located at 101 10th St, Penrose, CO 81240 and is currently estimated at $609,461, approximately $81 per square foot. 101 10th St is a home located in Fremont County with nearby schools including Penrose Elementary School and Florence High School.
Ownership History
Date
Name
Owned For
Owner Type
Purchase Details
Closed on
Nov 21, 2024
Sold by
Mary Griggs Trust and Griggs Mary D
Bought by
Griggs Mary D
Current Estimated Value
Purchase Details
Closed on
Oct 18, 2024
Sold by
Nfw Lllp
Bought by
Mary Griggs Trust
Purchase Details
Closed on
Nov 6, 2017
Sold by
Sa Group Properties Inc
Bought by
Nfw Lllp
Purchase Details
Closed on
Feb 2, 2017
Sold by
Croft Randy J
Bought by
Sa Group Properties Inc
Purchase Details
Closed on
Oct 12, 2012
Sold by
Croft Randy J
Bought by
Croft Randy J and Croft Shelley D
Purchase Details
Closed on
Jun 28, 2011
Sold by
Hinton Stan and Hinton Kristin A
Bought by
Croft Randy J
Home Financials for this Owner
Home Financials are based on the most recent Mortgage that was taken out on this home.
Original Mortgage
$370,000
Interest Rate
4.7%
Mortgage Type
Commercial
Create a Home Valuation Report for This Property
The Home Valuation Report is an in-depth analysis detailing your home's value as well as a comparison with similar homes in the area
Home Values in the Area
Average Home Value in this Area
Purchase History
| Date | Buyer | Sale Price | Title Company |
|---|---|---|---|
| Griggs Mary D | -- | None Listed On Document | |
| Mary Griggs Trust | $475,000 | Land Title | |
| Nfw Lllp | $350,000 | First American Title Ins Co | |
| Sa Group Properties Inc | -- | None Available | |
| Croft Randy J | -- | None Available | |
| Croft Randy J | $400,000 | None Available |
Source: Public Records
Mortgage History
| Date | Status | Borrower | Loan Amount |
|---|---|---|---|
| Previous Owner | Croft Randy J | $370,000 |
Source: Public Records
Tax History Compared to Growth
Tax History
| Year | Tax Paid | Tax Assessment Tax Assessment Total Assessment is a certain percentage of the fair market value that is determined by local assessors to be the total taxable value of land and additions on the property. | Land | Improvement |
|---|---|---|---|---|
| 2024 | $7,325 | $101,671 | $101,671 | $0 |
| 2023 | $7,325 | $91,069 | $91,069 | $0 |
| 2022 | $7,352 | $100,826 | $100,826 | $0 |
| 2021 | $7,235 | $100,826 | $0 | $0 |
| 2020 | $5,430 | $88,353 | $88,353 | $0 |
| 2019 | $5,454 | $88,353 | $88,353 | $0 |
| 2018 | $5,096 | $82,735 | $0 | $0 |
| 2017 | $5,187 | $82,735 | $0 | $0 |
| 2016 | $4,979 | $80,670 | $0 | $0 |
| 2015 | $4,918 | $80,670 | $0 | $0 |
| 2012 | $5,570 | $84,307 | $24,650 | $59,657 |
Source: Public Records
Map
Nearby Homes