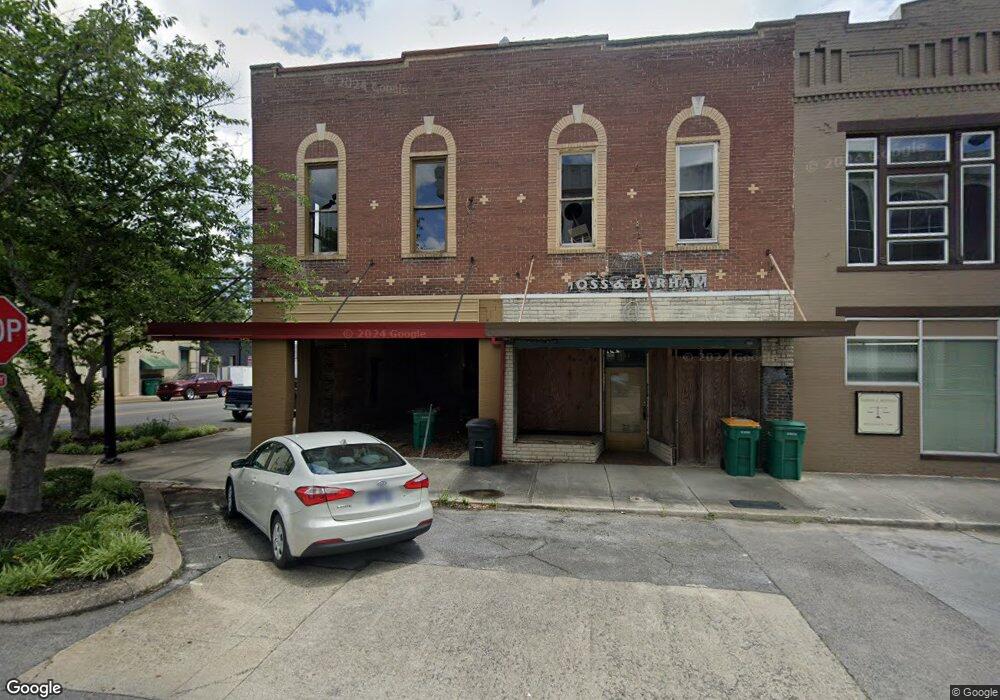
101 1st Ave S Lewisburg, TN 37091
Estimated Value: $21,791
--
Bed
--
Bath
1,605
Sq Ft
$14/Sq Ft
Est. Value
About This Home
This home is located at 101 1st Ave S, Lewisburg, TN 37091 and is currently estimated at $21,791, approximately $13 per square foot. 101 1st Ave S is a home located in Marshall County with nearby schools including Marshall Elementary School, Oak Grove Elementary School, and Westhills Elementary School.
Ownership History
Date
Name
Owned For
Owner Type
Purchase Details
Closed on
Sep 11, 2017
Sold by
Brooks David J
Bought by
Venator Beau and Brumley Patti
Current Estimated Value
Purchase Details
Closed on
Mar 4, 2016
Sold by
Weaver Dorris Wayne
Bought by
Brooks David J
Purchase Details
Closed on
Mar 26, 2013
Sold by
Walker Plantation Llc
Bought by
Weaver Dorris Wayne and Weaver Rita Anne
Purchase Details
Closed on
Dec 9, 2011
Sold by
570877 Us Inc
Bought by
Walker Plantation Llc
Purchase Details
Closed on
Oct 21, 2008
Sold by
Thompson Sue A
Bought by
570877 Us Inc
Purchase Details
Closed on
Aug 13, 2008
Sold by
Tom Thompson John
Bought by
Thompson Sue A
Purchase Details
Closed on
Oct 18, 1996
Sold by
Nations Bank Of Tn
Bought by
John Thompson
Purchase Details
Closed on
Nov 28, 1995
Bought by
Nations Bank Of Tn
Purchase Details
Closed on
Jan 23, 1990
Bought by
Roberts Ed
Create a Home Valuation Report for This Property
The Home Valuation Report is an in-depth analysis detailing your home's value as well as a comparison with similar homes in the area
Home Values in the Area
Average Home Value in this Area
Purchase History
| Date | Buyer | Sale Price | Title Company |
|---|---|---|---|
| Venator Beau | $11,000 | -- | |
| Brooks David J | $15,000 | -- | |
| Weaver Dorris Wayne | $5,000 | -- | |
| Walker Plantation Llc | $3,500 | -- | |
| 570877 Us Inc | $8,000 | -- | |
| Thompson Sue A | $12,000 | -- | |
| John Thompson | $12,000 | -- | |
| Nations Bank Of Tn | $31,900 | -- | |
| Roberts Ed | $30,000 | -- |
Source: Public Records
Tax History Compared to Growth
Tax History
| Year | Tax Paid | Tax Assessment Tax Assessment Total Assessment is a certain percentage of the fair market value that is determined by local assessors to be the total taxable value of land and additions on the property. | Land | Improvement |
|---|---|---|---|---|
| 2024 | -- | $4,800 | $2,480 | $2,320 |
| 2023 | $149 | $4,800 | $2,480 | $2,320 |
| 2022 | $149 | $4,800 | $2,480 | $2,320 |
| 2021 | $208 | $4,480 | $2,400 | $2,080 |
| 2020 | $208 | $4,480 | $2,400 | $2,080 |
| 2019 | $202 | $4,480 | $2,400 | $2,080 |
| 2018 | $200 | $4,480 | $2,400 | $2,080 |
| 2017 | $200 | $4,480 | $2,400 | $2,080 |
| 2016 | $219 | $4,280 | $2,560 | $1,720 |
| 2015 | $200 | $4,280 | $2,560 | $1,720 |
| 2014 | $200 | $4,280 | $2,560 | $1,720 |
Source: Public Records
Map
Nearby Homes
- 319 E Hill Ave
- 416 1st Ave N
- 316 Haynes St
- 215 5th Ave N
- 543 2nd Ave N
- 518 Maple St
- 525 Maple St
- 726 Thomas Ave
- 0 New Lake Rd Unit RTC3030964
- 610 Forrest St
- 535 Clayton Ave
- 638 2nd Ave N
- 594 5th Ave N
- 231 Greenwood St
- 627 6th Ave N
- 319 Greenwood St
- 630 6th Ave N
- 640 6th Ave S
- 1600 Larry Dospil Dr
- 224 Hardison Ave
- 103 1st Ave S
- 111 1st Ave S
- 115 E Commerce St
- 113 S 1st Ave
- 101 N 1st Ave
- 110 E Commerce St
- 121 1st Ave S
- 125 E Commerce St
- 113 N 1st Ave
- 116 E Ewing St
- 120 E Commerce St
- 3 Belfast St
- 113 W Commerce St
- 104 Belfast St
- 115 Rutledge Ln
- 126 E Ewing St
- 112 Belfast St
- 132 E Ewing St
- 121 N 2nd Ave
- 111 N 2nd Ave