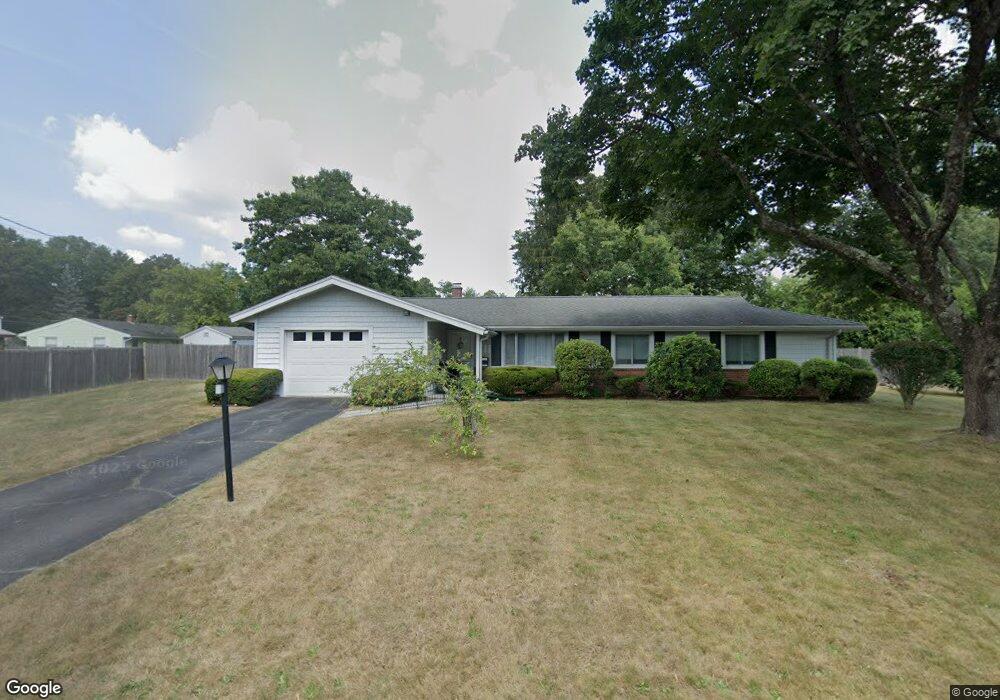
101 Annadea Rd Brockton, MA 02302
Estimated Value: $499,002 - $502,000
3
Beds
2
Baths
1,428
Sq Ft
$350/Sq Ft
Est. Value
About This Home
This home is located at 101 Annadea Rd, Brockton, MA 02302 and is currently estimated at $500,501, approximately $350 per square foot. 101 Annadea Rd is a home located in Plymouth County with nearby schools including Brookfield Elementary School, Mary E. Baker Elementary School, and Downey Elementary School.
Ownership History
Date
Name
Owned For
Owner Type
Purchase Details
Closed on
Aug 28, 1987
Sold by
Roach Glengoff
Bought by
Tiberii Rolly O
Current Estimated Value
Create a Home Valuation Report for This Property
The Home Valuation Report is an in-depth analysis detailing your home's value as well as a comparison with similar homes in the area
Purchase History
| Date | Buyer | Sale Price | Title Company |
|---|---|---|---|
| Tiberii Rolly O | $120,500 | -- |
Source: Public Records
Mortgage History
| Date | Status | Borrower | Loan Amount |
|---|---|---|---|
| Open | Tiberii Rolly O | $50,000 | |
| Closed | Tiberii Rolly O | $78,800 | |
| Closed | Tiberii Rolly O | $78,800 |
Source: Public Records
Tax History Compared to Growth
Tax History
| Year | Tax Paid | Tax Assessment Tax Assessment Total Assessment is a certain percentage of the fair market value that is determined by local assessors to be the total taxable value of land and additions on the property. | Land | Improvement |
|---|---|---|---|---|
| 2025 | $5,412 | $446,900 | $144,900 | $302,000 |
| 2024 | $5,106 | $424,800 | $144,900 | $279,900 |
| 2023 | $4,970 | $382,900 | $109,900 | $273,000 |
| 2022 | $4,606 | $329,700 | $99,900 | $229,800 |
| 2021 | $4,331 | $298,700 | $94,700 | $204,000 |
| 2020 | $4,472 | $295,200 | $90,700 | $204,500 |
| 2019 | $4,087 | $263,000 | $85,100 | $177,900 |
| 2018 | $4,071 | $253,500 | $85,100 | $168,400 |
| 2017 | $3,858 | $239,600 | $85,100 | $154,500 |
| 2016 | $3,574 | $205,900 | $81,100 | $124,800 |
| 2015 | $3,670 | $202,200 | $81,100 | $121,100 |
| 2014 | $3,512 | $193,700 | $81,100 | $112,600 |
Source: Public Records
Map
Nearby Homes