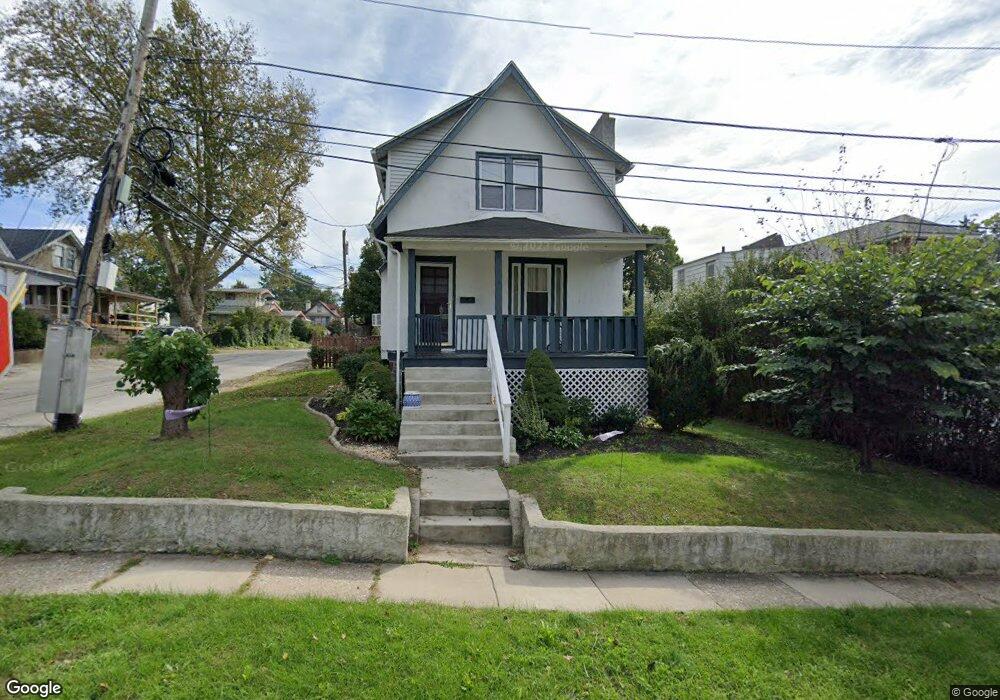
101 Ardmore Ave Upper Darby, PA 19082
Estimated Value: $307,139 - $373,000
3
Beds
3
Baths
1,610
Sq Ft
$210/Sq Ft
Est. Value
About This Home
This home is located at 101 Ardmore Ave, Upper Darby, PA 19082 and is currently estimated at $338,035, approximately $209 per square foot. 101 Ardmore Ave is a home located in Delaware County with nearby schools including Drexel Hill Middle School, Upper Darby High School, and St. Laurence's School.
Ownership History
Date
Name
Owned For
Owner Type
Purchase Details
Closed on
Sep 14, 2011
Sold by
Doney Jennifer L
Bought by
Lassane Nana
Current Estimated Value
Home Financials for this Owner
Home Financials are based on the most recent Mortgage that was taken out on this home.
Original Mortgage
$164,715
Interest Rate
4.12%
Mortgage Type
FHA
Purchase Details
Closed on
Dec 6, 2004
Sold by
Ke Wenjing and Sun Wei
Bought by
Doney Jennifer L
Home Financials for this Owner
Home Financials are based on the most recent Mortgage that was taken out on this home.
Original Mortgage
$143,900
Interest Rate
4.75%
Mortgage Type
Fannie Mae Freddie Mac
Purchase Details
Closed on
May 24, 2004
Sold by
Breslin Daniel G and Breslin Eleanor E
Bought by
Sun Wei and Ke Wen Jing
Home Financials for this Owner
Home Financials are based on the most recent Mortgage that was taken out on this home.
Original Mortgage
$104,800
Interest Rate
5.24%
Mortgage Type
Purchase Money Mortgage
Create a Home Valuation Report for This Property
The Home Valuation Report is an in-depth analysis detailing your home's value as well as a comparison with similar homes in the area
Home Values in the Area
Average Home Value in this Area
Purchase History
| Date | Buyer | Sale Price | Title Company |
|---|---|---|---|
| Lassane Nana | $169,000 | Golden Title Agency | |
| Doney Jennifer L | $179,900 | -- | |
| Sun Wei | $131,000 | -- |
Source: Public Records
Mortgage History
| Date | Status | Borrower | Loan Amount |
|---|---|---|---|
| Previous Owner | Lassane Nana | $164,715 | |
| Previous Owner | Doney Jennifer L | $143,900 | |
| Previous Owner | Sun Wei | $104,800 |
Source: Public Records
Tax History Compared to Growth
Tax History
| Year | Tax Paid | Tax Assessment Tax Assessment Total Assessment is a certain percentage of the fair market value that is determined by local assessors to be the total taxable value of land and additions on the property. | Land | Improvement |
|---|---|---|---|---|
| 2025 | $5,676 | $134,210 | $41,920 | $92,290 |
| 2024 | $5,676 | $134,210 | $41,920 | $92,290 |
| 2023 | $5,622 | $134,210 | $41,920 | $92,290 |
| 2022 | $5,471 | $134,210 | $41,920 | $92,290 |
| 2021 | $7,377 | $134,210 | $41,920 | $92,290 |
| 2020 | $5,798 | $89,640 | $30,130 | $59,510 |
| 2019 | $5,697 | $89,640 | $30,130 | $59,510 |
| 2018 | $5,631 | $89,640 | $0 | $0 |
| 2017 | $5,485 | $89,640 | $0 | $0 |
| 2016 | $492 | $89,640 | $0 | $0 |
| 2015 | $492 | $89,640 | $0 | $0 |
| 2014 | $492 | $89,640 | $0 | $0 |
Source: Public Records
Map
Nearby Homes
- 241 S Cedar Ln
- 148 Meadowbrook Ave
- 11 S Cedar Ln
- 8125 W Chester Pike Unit A4
- 228 N Linden Ave
- 201 Saint Laurence Rd
- 7819 Westview Ave
- 7823 Arlington Ave
- 71 S Brighton Ave
- 2219 Ardmore Ave
- 7920 W Chester Pike
- 8525 Monroe Ave
- 221 E Park Rd
- 223 E Park Rd
- 104 Brentwood Rd
- 171 N Carol Blvd
- 110 E Township Line Rd
- 105 N Fairview Ave
- 2354 Bond Ave
- 852 Windermere Ave
- 105 Ardmore Ave
- 8100 Merion Ave
- 8131 Merion Ave
- 5 Ardmore Ave
- 8127 Merion Ave
- 108 S Lynn Blvd
- 26 S Lynn Blvd
- 8106 Merion Ave
- 108 Ardmore Ave
- 112 S Lynn Blvd
- 4 Ardmore Ave
- 115 Ardmore Ave
- 110 Ardmore Ave
- 110 S Lynn Blvd
- 24 S Lynn Blvd
- 22 S Lynn Blvd
- 116 S Lynn Blvd
- 112 Ardmore Ave
- 18 S Lynn Blvd
- 117 Ardmore Ave