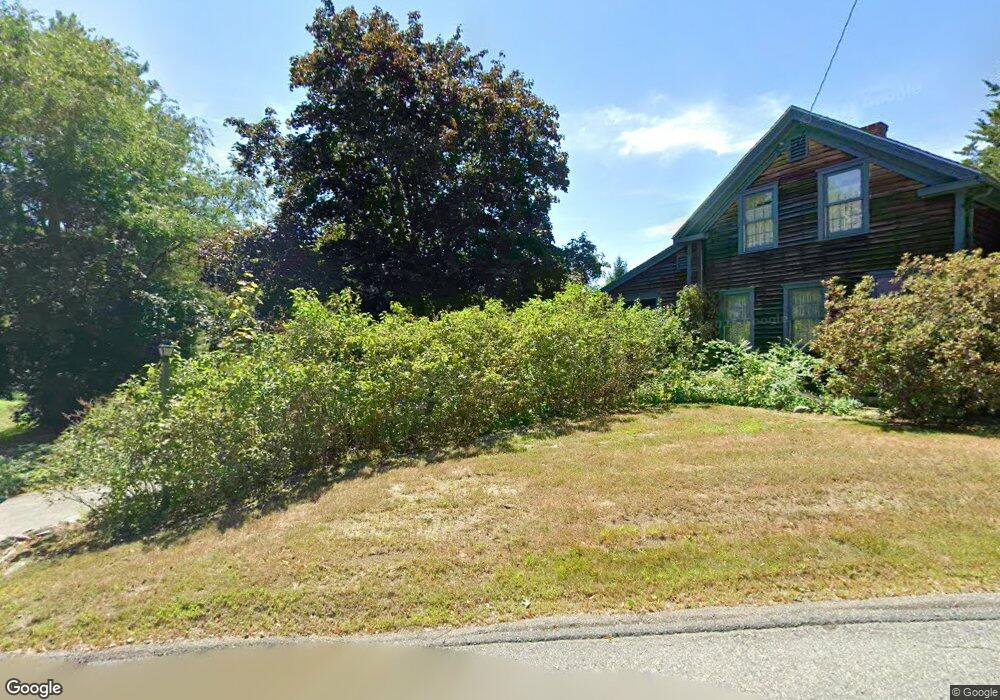
101 Bennett St Wrentham, MA 02093
Estimated Value: $532,000 - $797,000
3
Beds
2
Baths
1,434
Sq Ft
$454/Sq Ft
Est. Value
About This Home
This home is located at 101 Bennett St, Wrentham, MA 02093 and is currently estimated at $650,889, approximately $453 per square foot. 101 Bennett St is a home located in Norfolk County with nearby schools including Delaney Elementary School and Charles E Roderick.
Ownership History
Date
Name
Owned For
Owner Type
Purchase Details
Closed on
May 12, 2021
Sold by
Hession Marjorie A
Bought by
M A Hession T 2021
Current Estimated Value
Purchase Details
Closed on
Sep 6, 1988
Sold by
E & S Rt
Bought by
Hession Marjorie A
Home Financials for this Owner
Home Financials are based on the most recent Mortgage that was taken out on this home.
Original Mortgage
$110,000
Interest Rate
10.38%
Mortgage Type
Purchase Money Mortgage
Create a Home Valuation Report for This Property
The Home Valuation Report is an in-depth analysis detailing your home's value as well as a comparison with similar homes in the area
Purchase History
| Date | Buyer | Sale Price | Title Company |
|---|---|---|---|
| M A Hession T 2021 | -- | None Available | |
| Hession Marjorie A | $187,000 | -- |
Source: Public Records
Mortgage History
| Date | Status | Borrower | Loan Amount |
|---|---|---|---|
| Previous Owner | Hession Marjorie A | $75,000 | |
| Previous Owner | Hession Marjorie A | $110,000 |
Source: Public Records
Tax History
| Year | Tax Paid | Tax Assessment Tax Assessment Total Assessment is a certain percentage of the fair market value that is determined by local assessors to be the total taxable value of land and additions on the property. | Land | Improvement |
|---|---|---|---|---|
| 2025 | $6,639 | $572,800 | $304,800 | $268,000 |
| 2024 | $6,403 | $533,600 | $304,800 | $228,800 |
| 2023 | $6,260 | $496,000 | $277,200 | $218,800 |
| 2022 | $6,123 | $447,900 | $258,700 | $189,200 |
| 2021 | $5,814 | $413,200 | $226,100 | $187,100 |
| 2020 | $5,686 | $399,000 | $201,300 | $197,700 |
| 2019 | $5,572 | $394,600 | $201,300 | $193,300 |
| 2018 | $5,367 | $376,900 | $201,500 | $175,400 |
| 2017 | $5,144 | $361,000 | $197,600 | $163,400 |
| 2016 | $4,965 | $347,700 | $191,900 | $155,800 |
| 2015 | $4,831 | $322,500 | $184,500 | $138,000 |
| 2014 | $4,795 | $313,200 | $177,500 | $135,700 |
Source: Public Records
Map
Nearby Homes
- 10 Earle Stewart Ln Unit Lot 5
- 12 Earle Stewart Ln
- 2 Earle Stewart Ln
- 3 Earle Stewart Ln
- 440 Chestnut St
- 613 West St
- 1222 South St
- 500 Franklin St
- 955 Summer St
- 10 Nature View Dr
- 15 Nature View Dr
- 0 Berry St
- 18 Huntington Ave
- 20 Field Cir
- 19 Chestnut Lot 0
- 0 Fall Ln
- 11 Amber Dr
- 287 Park St
- 50 Reed Fulton Ave Unit Lot 61
- 160 Washington St Unit 22
- 10 Roger Goodwin Dr
- 20 Roger Goodwin Dr
- 15 Roger Goodwin Dr
- 91 Bennett St
- 96 Bennett St
- 30 Roger Goodwin Dr
- 90 Bennett St
- 71 Bennett St
- 71 Bennett St
- 25 Roger Goodwin Dr
- 100 Bennett St
- 40 Roger Goodwin Dr
- 119 Bennett St
- 145 Bennett St
- 35 Roger Goodwin Dr
- 92 Bennett St
- 110 Bennett St
- 94 Bennett St
- 7 Cranberry Ln
- 135 Bennett St
Your Personal Tour Guide
Ask me questions while you tour the home.