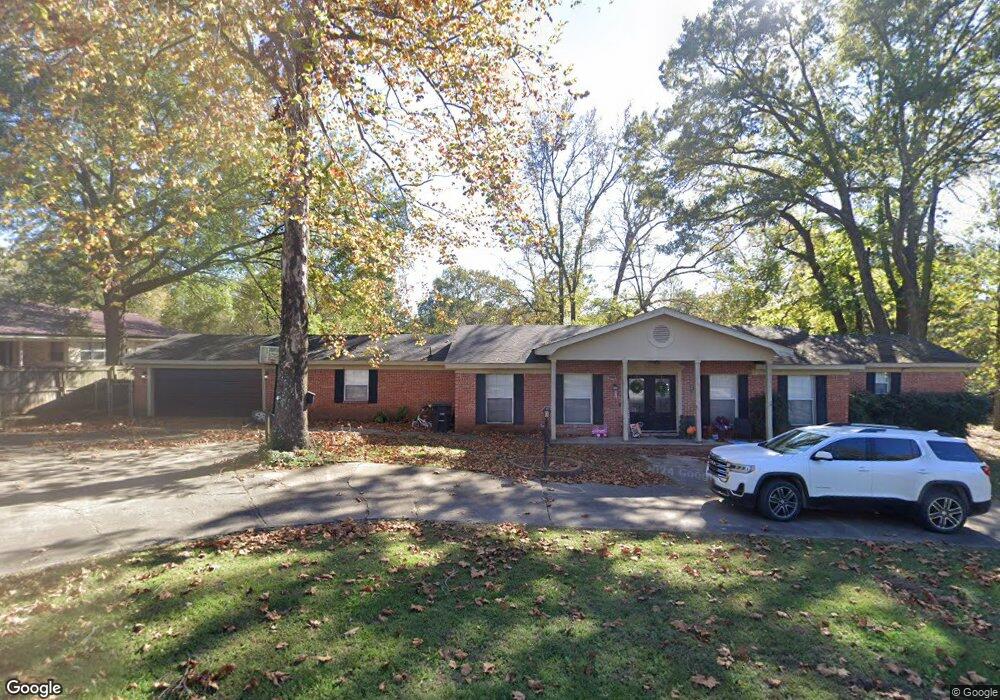
101 Callis St Broken Bow, OK 74728
Estimated Value: $172,327 - $356,000
3
Beds
3
Baths
2,788
Sq Ft
$97/Sq Ft
Est. Value
About This Home
This home is located at 101 Callis St, Broken Bow, OK 74728 and is currently estimated at $269,582, approximately $96 per square foot. 101 Callis St is a home located in McCurtain County with nearby schools including Dierks Elementary School, Bennett Elementary School, and Rector Johnson Middle School.
Ownership History
Date
Name
Owned For
Owner Type
Purchase Details
Closed on
Aug 17, 2023
Sold by
Batson Alecia and Batson Michael Scott
Bought by
Batson Alecia
Current Estimated Value
Home Financials for this Owner
Home Financials are based on the most recent Mortgage that was taken out on this home.
Original Mortgage
$187,220
Outstanding Balance
$182,560
Interest Rate
6.78%
Mortgage Type
FHA
Estimated Equity
$87,022
Purchase Details
Closed on
Oct 21, 2019
Sold by
Hobson Michael J and Hobson Kelly
Bought by
Batson Alecia and Batson Michael Scott
Home Financials for this Owner
Home Financials are based on the most recent Mortgage that was taken out on this home.
Original Mortgage
$142,373
Interest Rate
3.62%
Mortgage Type
FHA
Purchase Details
Closed on
Feb 16, 2012
Sold by
Evans Rodney and Evans Judy
Bought by
Hobson Michael J and Hobson Kelly
Purchase Details
Closed on
Dec 1, 2008
Sold by
Evans Yvonne
Bought by
Evans Rodney and Monroe Robin
Create a Home Valuation Report for This Property
The Home Valuation Report is an in-depth analysis detailing your home's value as well as a comparison with similar homes in the area
Home Values in the Area
Average Home Value in this Area
Purchase History
| Date | Buyer | Sale Price | Title Company |
|---|---|---|---|
| Batson Alecia | -- | Chicago Title | |
| Batson Alecia | $145,000 | None Available | |
| Hobson Michael J | $80,000 | None Available | |
| Evans Rodney | -- | -- |
Source: Public Records
Mortgage History
| Date | Status | Borrower | Loan Amount |
|---|---|---|---|
| Open | Batson Alecia | $187,220 | |
| Previous Owner | Batson Alecia | $142,373 |
Source: Public Records
Tax History Compared to Growth
Tax History
| Year | Tax Paid | Tax Assessment Tax Assessment Total Assessment is a certain percentage of the fair market value that is determined by local assessors to be the total taxable value of land and additions on the property. | Land | Improvement |
|---|---|---|---|---|
| 2025 | $770 | $9,695 | $120 | $9,575 |
| 2024 | $770 | $9,233 | $114 | $9,119 |
| 2023 | $721 | $8,794 | $112 | $8,682 |
| 2022 | $687 | $8,376 | $111 | $8,265 |
| 2021 | $643 | $7,976 | $105 | $7,871 |
| 2020 | $617 | $7,596 | $100 | $7,496 |
| 2019 | $591 | $7,235 | $93 | $7,142 |
| 2018 | $569 | $6,891 | $87 | $6,804 |
| 2017 | $546 | $6,563 | $81 | $6,482 |
| 2016 | $524 | $6,250 | $129 | $6,121 |
| 2015 | $537 | $6,250 | $129 | $6,121 |
| 2014 | $540 | $6,250 | $129 | $6,121 |
Source: Public Records
Map
Nearby Homes
- 2 Beaver St
- 509 Clay St
- 302 Airport Rd
- 707 S Mcclure St
- 1266 W Memorial St
- 727 Airport Rd
- 75 Redbud Springs Trail
- 205 Wallace St
- 309 E Memorial St
- 81 Annie Oak Trail
- Tebo Jones Rd
- 1912 S Park Dr
- 124 N Main St
- 2002 S Park Dr
- 44 Blue Ivy Cir
- 189 Sweet Gum Trail
- 168 Basswood Trail
- 2006 Kuykendall Rd
- 2008 Kuykendall Rd
- 2007 Kuykendall Rd