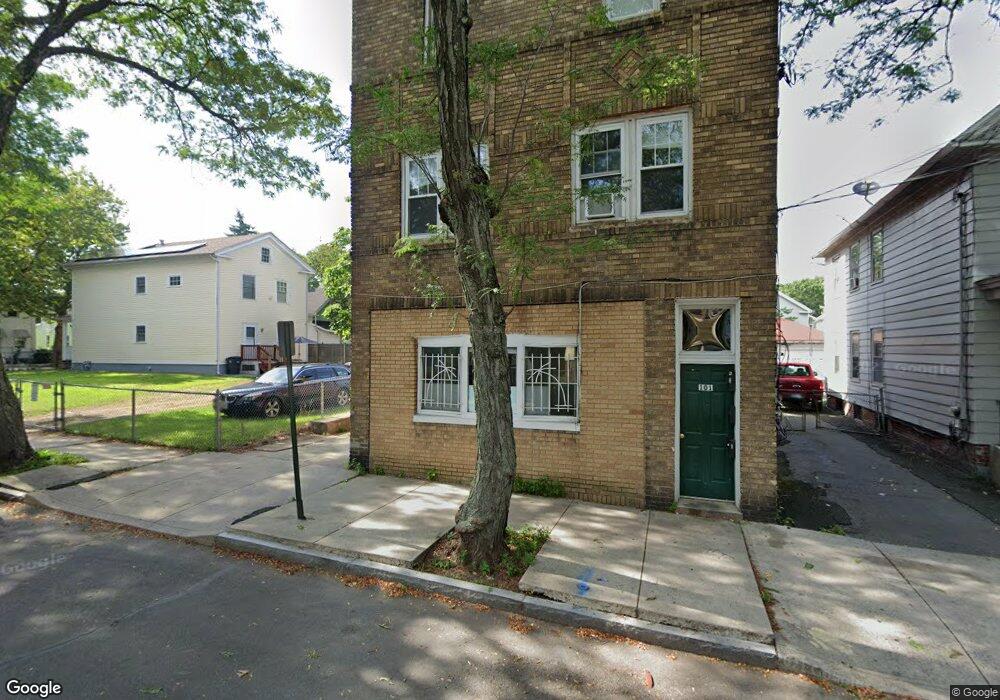
101 Carlisle St Unit 3 New Haven, CT 06519
The Hill NeighborhoodEstimated Value: $392,000 - $469,000
2
Beds
1
Bath
805
Sq Ft
$550/Sq Ft
Est. Value
About This Home
This home is located at 101 Carlisle St Unit 3, New Haven, CT 06519 and is currently estimated at $442,764, approximately $550 per square foot. 101 Carlisle St Unit 3 is a home located in New Haven County with nearby schools including John C. Daniels and St Martin De Porres Academy.
Ownership History
Date
Name
Owned For
Owner Type
Purchase Details
Closed on
Aug 19, 2022
Sold by
Fillion Kara L
Bought by
Tecpa Lupita M
Current Estimated Value
Purchase Details
Closed on
May 10, 2019
Sold by
Hernandez Elba and Machicote Orlando
Bought by
Fillion Kara L
Home Financials for this Owner
Home Financials are based on the most recent Mortgage that was taken out on this home.
Original Mortgage
$179,036
Interest Rate
4%
Mortgage Type
Purchase Money Mortgage
Purchase Details
Closed on
Jun 12, 2015
Sold by
Ortiz Maria
Bought by
Hernandez Elba
Home Financials for this Owner
Home Financials are based on the most recent Mortgage that was taken out on this home.
Original Mortgage
$144,337
Interest Rate
3.75%
Mortgage Type
FHA
Purchase Details
Closed on
Dec 22, 2011
Sold by
Ortiz Ramon
Bought by
Ortiz Maria E
Create a Home Valuation Report for This Property
The Home Valuation Report is an in-depth analysis detailing your home's value as well as a comparison with similar homes in the area
Home Values in the Area
Average Home Value in this Area
Purchase History
| Date | Buyer | Sale Price | Title Company |
|---|---|---|---|
| Tecpa Lupita M | $355,000 | None Available | |
| Fillion Kara L | $188,459 | -- | |
| Hernandez Elba | $147,000 | -- | |
| Ortiz Maria E | -- | -- |
Source: Public Records
Mortgage History
| Date | Status | Borrower | Loan Amount |
|---|---|---|---|
| Previous Owner | Fillion Kara L | $179,036 | |
| Previous Owner | Hernandez Elba | $144,337 |
Source: Public Records
Tax History Compared to Growth
Tax History
| Year | Tax Paid | Tax Assessment Tax Assessment Total Assessment is a certain percentage of the fair market value that is determined by local assessors to be the total taxable value of land and additions on the property. | Land | Improvement |
|---|---|---|---|---|
| 2025 | $6,004 | $152,390 | $22,540 | $129,850 |
| 2024 | $5,867 | $152,390 | $22,540 | $129,850 |
| 2023 | $5,669 | $152,390 | $22,540 | $129,850 |
| 2022 | $6,058 | $152,390 | $22,540 | $129,850 |
| 2021 | $3,913 | $89,180 | $19,460 | $69,720 |
| 2020 | $3,308 | $75,390 | $19,460 | $55,930 |
| 2019 | $3,240 | $75,390 | $19,460 | $55,930 |
| 2018 | $3,240 | $75,390 | $19,460 | $55,930 |
| 2017 | $2,916 | $75,390 | $19,460 | $55,930 |
| 2016 | $2,327 | $56,000 | $11,130 | $44,870 |
| 2015 | $2,327 | $56,000 | $11,130 | $44,870 |
| 2014 | $2,327 | $56,000 | $11,130 | $44,870 |
Source: Public Records
Map
Nearby Homes
- 46 Liberty St
- 33 Liberty St Unit M
- 25 Liberty St Unit E
- 533 Howard Ave
- 41 Cassius St
- 72 Daggett St
- 23 Dewitt St
- 26 Lamberton St
- 51 Arthur St
- 32 Lamberton St
- 148 Rosette St
- 45 Frank St
- 29 White St
- 46 Hurlburt St
- 82 1st St
- 148 Plymouth St
- 91 Church St Unit 3
- 91 Church St Unit 2
- 91 Church St Unit 1
- 133 Plymouth St
- 101 Carlisle St
- 97 Carlisle St
- 95 Carlisle St
- 59 Liberty St
- 61 Liberty St
- 104 Carlisle St
- 93 Carlisle St
- 89 Carlisle St
- 89 Carlisle St Unit 2
- 98 Carlisle St
- 63 Liberty St
- 140 Portsea St
- 96 Carlisle St
- 136 Portsea St
- 134 Portsea St
- 94 Carlisle St
- 94 Carlisle St Unit 2 bedroom apartment
- 94 Carlisle St Unit 2nd Floor Flex Apt
- 94 Carlisle St Unit 3rd Floor Studio
- 51 Liberty St