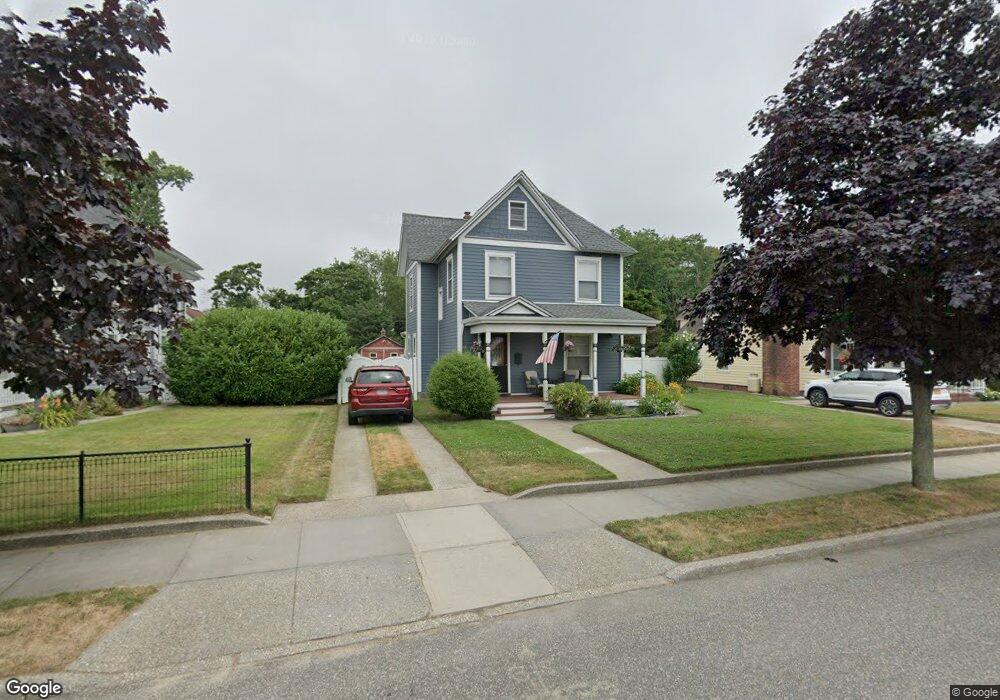
101 Cedar Ave Patchogue, NY 11772
Estimated Value: $527,000 - $788,000
3
Beds
2
Baths
1,852
Sq Ft
$353/Sq Ft
Est. Value
About This Home
This home is located at 101 Cedar Ave, Patchogue, NY 11772 and is currently estimated at $653,535, approximately $352 per square foot. 101 Cedar Ave is a home located in Suffolk County with nearby schools including Patchogue-Medford High School and Holy Angels Regional School.
Ownership History
Date
Name
Owned For
Owner Type
Purchase Details
Closed on
Aug 8, 2008
Sold by
Chesebro Charles F
Bought by
Balcuk Christine
Current Estimated Value
Home Financials for this Owner
Home Financials are based on the most recent Mortgage that was taken out on this home.
Original Mortgage
$298,800
Outstanding Balance
$196,783
Interest Rate
6.4%
Mortgage Type
Purchase Money Mortgage
Estimated Equity
$456,752
Purchase Details
Closed on
Aug 29, 1996
Sold by
Blume George and Blume Laura
Bought by
Chesebro Charles F and Chesebro Diane
Create a Home Valuation Report for This Property
The Home Valuation Report is an in-depth analysis detailing your home's value as well as a comparison with similar homes in the area
Home Values in the Area
Average Home Value in this Area
Purchase History
| Date | Buyer | Sale Price | Title Company |
|---|---|---|---|
| Balcuk Christine | $332,000 | Russell A Weber | |
| Chesebro Charles F | $130,000 | First American Title Ins Co |
Source: Public Records
Mortgage History
| Date | Status | Borrower | Loan Amount |
|---|---|---|---|
| Open | Balcuk Christine | $298,800 |
Source: Public Records
Tax History
| Year | Tax Paid | Tax Assessment Tax Assessment Total Assessment is a certain percentage of the fair market value that is determined by local assessors to be the total taxable value of land and additions on the property. | Land | Improvement |
|---|---|---|---|---|
| 2022 | $8,453 | $2,700 | $500 | $2,200 |
| 2021 | $8,453 | $2,700 | $500 | $2,200 |
| 2020 | $11,524 | $2,700 | $500 | $2,200 |
| 2019 | $11,488 | $0 | $0 | $0 |
Source: Public Records
Map
Nearby Homes
- 89 Cedar Ave
- 215 West Ave
- 109 Laurel St
- 51 Cedar Ave
- 3 Carman St
- 43 Wiggins Ave
- 263 River Ave Unit 16AU
- 263 River Ave Unit 5LD - Building 1
- 51 Marvin St
- 134 Jackie Ct
- 247 Rider Ave
- 25 Patchogue St
- 16 Bransford St
- Arlington Patchogue St
- 358 Rider Ave
- 73 Brightwood St
- 50 Furman Ln
- 54 Barley Ln
- 47 Thorburn Ave
- 808 Emily Dr
Your Personal Tour Guide
Ask me questions while you tour the home.