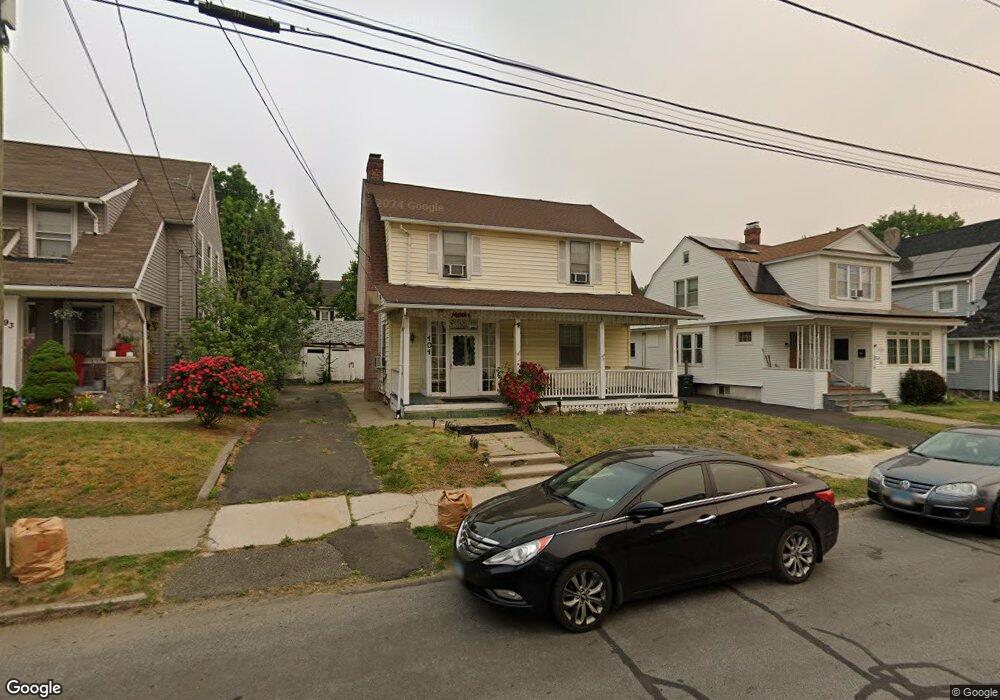
101 Chalmers Ave Bridgeport, CT 06604
Brooklawn-Saint Vincent NeighborhoodEstimated Value: $393,000 - $451,456
3
Beds
2
Baths
1,575
Sq Ft
$269/Sq Ft
Est. Value
About This Home
This home is located at 101 Chalmers Ave, Bridgeport, CT 06604 and is currently estimated at $423,614, approximately $268 per square foot. 101 Chalmers Ave is a home located in Fairfield County with nearby schools including Madison School, Central High School, and Catholic Academy of Bridgeport-St. Raphael Academy.
Ownership History
Date
Name
Owned For
Owner Type
Purchase Details
Closed on
Jun 13, 2006
Sold by
Vinson Craig and Vinson Cara
Bought by
Harding Samuel and Harding Barbara
Current Estimated Value
Home Financials for this Owner
Home Financials are based on the most recent Mortgage that was taken out on this home.
Original Mortgage
$280,550
Outstanding Balance
$165,402
Interest Rate
6.62%
Estimated Equity
$258,212
Purchase Details
Closed on
Sep 10, 2004
Sold by
Hordeck Mary Ellen
Bought by
Vinson Craig and Vinson Cara
Home Financials for this Owner
Home Financials are based on the most recent Mortgage that was taken out on this home.
Original Mortgage
$200,000
Interest Rate
4.62%
Purchase Details
Closed on
Aug 30, 2002
Sold by
Chrc Golden Hl U Metho
Bought by
Horodeck Maryellen
Purchase Details
Closed on
Sep 6, 2000
Sold by
Roman George and Roman Antoinette
Bought by
Golden Hill United Met
Create a Home Valuation Report for This Property
The Home Valuation Report is an in-depth analysis detailing your home's value as well as a comparison with similar homes in the area
Home Values in the Area
Average Home Value in this Area
Purchase History
| Date | Buyer | Sale Price | Title Company |
|---|---|---|---|
| Harding Samuel | $285,000 | -- | |
| Harding Samuel | $285,000 | -- | |
| Vinson Craig | $250,000 | -- | |
| Vinson Craig | $250,000 | -- | |
| Horodeck Maryellen | $186,900 | -- | |
| Horodeck Maryellen | $186,900 | -- | |
| Golden Hill United Met | $156,000 | -- | |
| Golden Hill United Met | $156,000 | -- |
Source: Public Records
Mortgage History
| Date | Status | Borrower | Loan Amount |
|---|---|---|---|
| Open | Golden Hill United Met | $280,550 | |
| Closed | Golden Hill United Met | $280,550 | |
| Previous Owner | Golden Hill United Met | $200,000 |
Source: Public Records
Tax History Compared to Growth
Tax History
| Year | Tax Paid | Tax Assessment Tax Assessment Total Assessment is a certain percentage of the fair market value that is determined by local assessors to be the total taxable value of land and additions on the property. | Land | Improvement |
|---|---|---|---|---|
| 2025 | $6,775 | $155,920 | $77,610 | $78,310 |
| 2024 | $6,775 | $155,920 | $77,610 | $78,310 |
| 2023 | $6,775 | $155,920 | $77,610 | $78,310 |
| 2022 | $6,775 | $155,920 | $77,610 | $78,310 |
| 2021 | $6,775 | $155,920 | $77,610 | $78,310 |
| 2020 | $6,543 | $121,190 | $47,030 | $74,160 |
| 2019 | $6,543 | $121,190 | $47,030 | $74,160 |
| 2018 | $6,589 | $121,190 | $47,030 | $74,160 |
| 2017 | $6,589 | $121,190 | $47,030 | $74,160 |
| 2016 | $6,589 | $121,190 | $47,030 | $74,160 |
| 2015 | $6,450 | $152,850 | $52,160 | $100,690 |
| 2014 | $6,450 | $152,850 | $52,160 | $100,690 |
Source: Public Records
Map
Nearby Homes
- 125 E Eaton St
- 100 Lorraine St
- 665 W Taft Ave
- 191 Oak St
- 2345 Park Ave
- 31 Taft Ave
- 1275 Capitol Ave
- 687 Wood Ave
- 184 Pacific St
- 1480 Capitol Ave Unit 811
- 318 Center St
- 566 Wood Ave
- 1213 Wood Ave
- 2445 Park Ave Unit 23
- 826 Norman St
- 309 Pequonnock St
- 78 Fairmount Ave
- 414 Wood Ave
- 390 Charles St Unit 106
- 366 Brooklawn Ave
- 111 Chalmers Ave
- 93 Chalmers Ave
- 94 Bancroft Ave
- 104 Bancroft Ave
- 121 Chalmers Ave
- 81 Chalmers Ave
- 82 Bancroft Ave
- 112 Chalmers Ave
- 116 Bancroft Ave
- 100 Chalmers Ave
- 86 Chalmers Ave
- 131 Chalmers Ave
- 72 Bancroft Ave
- 63 Chalmers Ave
- 120 Chalmers Ave
- 76 Chalmers Ave
- 101 Bancroft Ave
- 64 Bancroft Ave
- 40 Bancroft Ave
- 134 Chalmers Ave