Estimated Value: $128,688 - $255,000
--
Bed
2
Baths
1,476
Sq Ft
$122/Sq Ft
Est. Value
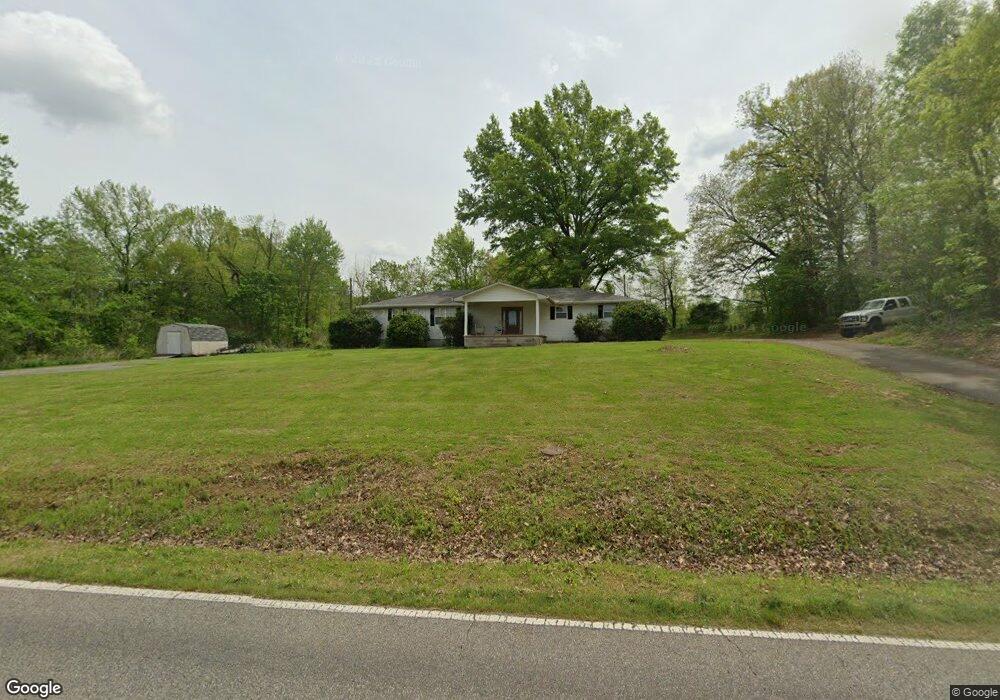
About This Home
This home is located at 101 Concord Cades Rd, Milan, TN 38358 and is currently estimated at $180,172, approximately $122 per square foot. 101 Concord Cades Rd is a home located in Gibson County with nearby schools including Milan Elementary School, Milan Middle School, and Milan High School.
Ownership History
Date
Name
Owned For
Owner Type
Purchase Details
Closed on
Apr 15, 2004
Sold by
Emert Kathy S and Emert Levon F
Bought by
Hayes Charles M and Hayes Katherine
Current Estimated Value
Home Financials for this Owner
Home Financials are based on the most recent Mortgage that was taken out on this home.
Original Mortgage
$56,000
Outstanding Balance
$25,584
Interest Rate
5.35%
Estimated Equity
$154,588
Purchase Details
Closed on
Sep 11, 2002
Sold by
Bank Of Dyer
Bought by
Emert Kathy S and Emert Levon F
Purchase Details
Closed on
Jul 27, 2002
Sold by
Denton Terry W
Bought by
Bank Of Dyer
Purchase Details
Closed on
Oct 5, 2000
Sold by
Denton James H
Bought by
Denton Terry W
Purchase Details
Closed on
May 16, 2000
Sold by
Oliver James Herbert
Bought by
Denton James H
Purchase Details
Closed on
Jan 2, 1987
Bought by
Oliver James Herbert
Purchase Details
Closed on
Dec 20, 1966
Purchase Details
Closed on
Feb 1, 1965
Purchase Details
Closed on
Mar 6, 1962
Create a Home Valuation Report for This Property
The Home Valuation Report is an in-depth analysis detailing your home's value as well as a comparison with similar homes in the area
Home Values in the Area
Average Home Value in this Area
Purchase History
| Date | Buyer | Sale Price | Title Company |
|---|---|---|---|
| Hayes Charles M | $76,000 | -- | |
| Emert Kathy S | $34,000 | -- | |
| Bank Of Dyer | $34,000 | -- | |
| Denton Terry W | $47,800 | -- | |
| Denton James H | $29,812 | -- | |
| Oliver James Herbert | -- | -- | |
| -- | -- | -- | |
| -- | -- | -- | |
| -- | -- | -- |
Source: Public Records
Mortgage History
| Date | Status | Borrower | Loan Amount |
|---|---|---|---|
| Open | Not Available | $56,000 |
Source: Public Records
Tax History Compared to Growth
Tax History
| Year | Tax Paid | Tax Assessment Tax Assessment Total Assessment is a certain percentage of the fair market value that is determined by local assessors to be the total taxable value of land and additions on the property. | Land | Improvement |
|---|---|---|---|---|
| 2025 | $527 | $23,025 | $0 | $0 |
| 2024 | $527 | $23,025 | $2,125 | $20,900 |
| 2023 | $512 | $15,700 | $1,975 | $13,725 |
| 2022 | $501 | $15,700 | $1,975 | $13,725 |
| 2021 | $512 | $15,700 | $1,975 | $13,725 |
| 2020 | $512 | $15,700 | $1,975 | $13,725 |
| 2019 | $512 | $15,700 | $1,975 | $13,725 |
| 2018 | $481 | $16,625 | $1,975 | $14,650 |
| 2017 | $473 | $16,625 | $1,975 | $14,650 |
| 2016 | $473 | $16,625 | $1,975 | $14,650 |
| 2015 | -- | $16,625 | $1,975 | $14,650 |
| 2014 | -- | $16,625 | $1,975 | $14,650 |
Source: Public Records
Map
Nearby Homes
- 83 Concord Cades Rd
- 69 Union Central Rd
- 106 Union Central Rd
- 413 Concord Cades Rd
- 35 Parker Ln
- 9020 N Main St
- 00 Oliver Chapel Rd
- 00 Trenton Hwy
- 87 Gann Rd
- 00 Middle Rd
- 0 Herbert Neal Rd
- 10 Randy Ln
- 73 Oak Grove Rd
- 2027 Middle Rd
- 152 Caraway Hills Rd
- 3011 Mckellar Cove
- 3036 N Main St
- 3083 Arnold St
- 4127 Bringle St
- 5987 Creekside Dr
- 97 Concord Cades Rd
- 93 Concord Cades Rd
- 130 Concord Cades Rd
- 113 Concord Cades Rd
- 121 Concord Cades Rd
- 129 Concord Cades Rd
- 78 Concord Cades Rd
- 75 Concord Cades Rd
- 65 Concord Cades Rd
- 16 Carnes Rd
- 137 Concord Cades Rd
- 140 Concord Cades Rd
- 66 Concord Cades Rd
- 35 Carnes Rd
- 150 Concord Cades Rd
- 53 Concord Cades Rd
- 151 Concord Cades Rd
- 155 Concord Cades Rd
- 0 Carnes Rd
- 41 Concord Cades Rd