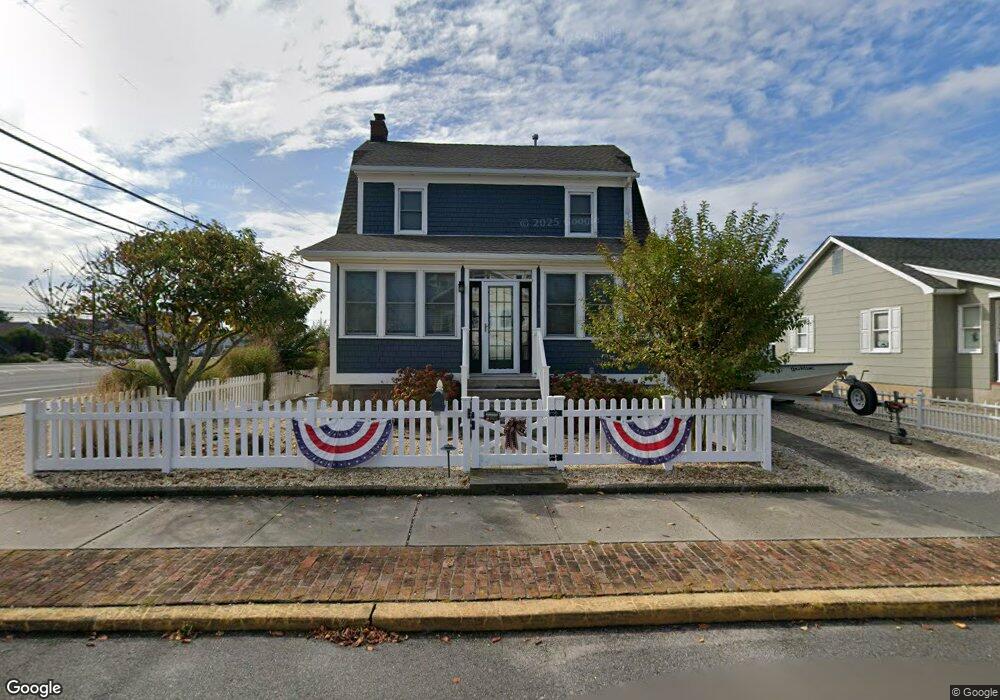
101 D St Seaside Park, NJ 08752
Estimated Value: $913,000 - $1,102,000
3
Beds
2
Baths
1,320
Sq Ft
$744/Sq Ft
Est. Value
About This Home
This home is located at 101 D St, Seaside Park, NJ 08752 and is currently estimated at $981,877, approximately $743 per square foot. 101 D St is a home located in Ocean County with nearby schools including Central Regional Middle School and Central Regional High School.
Ownership History
Date
Name
Owned For
Owner Type
Purchase Details
Closed on
Sep 17, 2008
Sold by
Boag James and Boag Jana
Bought by
Boag Michael
Current Estimated Value
Purchase Details
Closed on
Feb 22, 2008
Sold by
Emig Robert
Bought by
Boag Michael and Boag James
Purchase Details
Closed on
Feb 3, 2008
Sold by
Woodend Susan Emig
Bought by
Emig Robert Martin
Purchase Details
Closed on
Sep 20, 1999
Sold by
Emig Robert M
Bought by
Emig Robert M and Woodend Susan Emig
Create a Home Valuation Report for This Property
The Home Valuation Report is an in-depth analysis detailing your home's value as well as a comparison with similar homes in the area
Home Values in the Area
Average Home Value in this Area
Purchase History
| Date | Buyer | Sale Price | Title Company |
|---|---|---|---|
| Boag Michael | -- | Chicago Title Insurance Co | |
| Boag Michael | $550,000 | Chicago Title Insurance Co | |
| Emig Robert Martin | -- | None Available | |
| Emig Robert M | -- | -- |
Source: Public Records
Tax History Compared to Growth
Tax History
| Year | Tax Paid | Tax Assessment Tax Assessment Total Assessment is a certain percentage of the fair market value that is determined by local assessors to be the total taxable value of land and additions on the property. | Land | Improvement |
|---|---|---|---|---|
| 2025 | $9,034 | $552,200 | $360,000 | $192,200 |
| 2024 | $8,885 | $552,200 | $360,000 | $192,200 |
| 2023 | $8,570 | $552,200 | $360,000 | $192,200 |
| 2022 | $8,570 | $552,200 | $360,000 | $192,200 |
| 2021 | $8,388 | $552,200 | $360,000 | $192,200 |
| 2020 | $8,300 | $552,200 | $360,000 | $192,200 |
| 2019 | $8,211 | $552,200 | $360,000 | $192,200 |
| 2018 | $7,676 | $552,200 | $360,000 | $192,200 |
| 2017 | $7,792 | $552,200 | $360,000 | $192,200 |
| 2016 | $7,245 | $552,200 | $360,000 | $192,200 |
| 2015 | $7,560 | $552,200 | $360,000 | $192,200 |
| 2014 | $7,223 | $552,200 | $360,000 | $192,200 |
Source: Public Records
Map
Nearby Homes