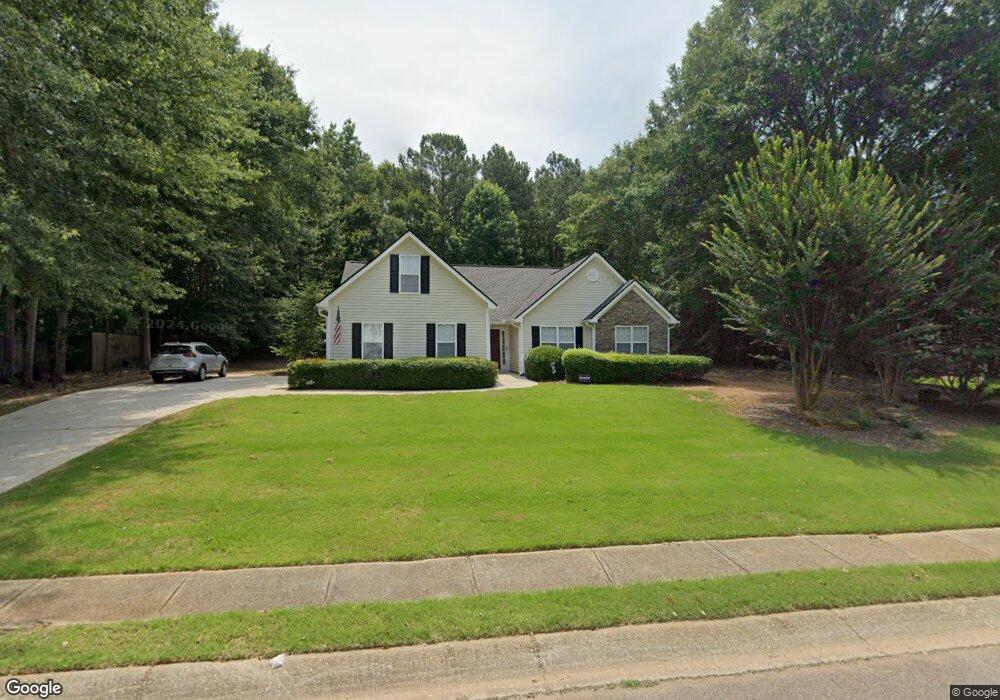
101 Dillon Dr Jefferson, GA 30549
Estimated Value: $329,000 - $423,000
3
Beds
2
Baths
1,678
Sq Ft
$215/Sq Ft
Est. Value
About This Home
This home is located at 101 Dillon Dr, Jefferson, GA 30549 and is currently estimated at $361,591, approximately $215 per square foot. 101 Dillon Dr is a home located in Jackson County with nearby schools including Gum Springs Elementary School, West Jackson Middle School, and Jackson County High School.
Ownership History
Date
Name
Owned For
Owner Type
Purchase Details
Closed on
May 12, 2021
Sold by
Thompson Rhonda B
Bought by
Thompson Paul A
Current Estimated Value
Home Financials for this Owner
Home Financials are based on the most recent Mortgage that was taken out on this home.
Original Mortgage
$152,176
Outstanding Balance
$8,869
Interest Rate
3.1%
Mortgage Type
Commercial
Estimated Equity
$352,722
Purchase Details
Closed on
Jul 24, 2009
Sold by
Us Bank Na
Bought by
Thompson Paul A
Home Financials for this Owner
Home Financials are based on the most recent Mortgage that was taken out on this home.
Original Mortgage
$77,501
Interest Rate
5.36%
Mortgage Type
Purchase Money Mortgage
Purchase Details
Closed on
Mar 3, 2009
Sold by
Us Bank Na
Bought by
Us Bank Na
Purchase Details
Closed on
Feb 24, 2006
Sold by
Not Provided
Bought by
Thompson Paul A and Thompson Rhonda B
Purchase Details
Closed on
Jun 28, 2002
Sold by
Nephew David
Bought by
Burgess Joe F
Purchase Details
Closed on
Dec 14, 2001
Sold by
Dunhill Developers Llc
Bought by
Nephew David
Create a Home Valuation Report for This Property
The Home Valuation Report is an in-depth analysis detailing your home's value as well as a comparison with similar homes in the area
Home Values in the Area
Average Home Value in this Area
Purchase History
| Date | Buyer | Sale Price | Title Company |
|---|---|---|---|
| Thompson Paul A | -- | -- | |
| Thompson Paul A | $70,000 | -- | |
| Us Bank Na | $111,000 | -- | |
| Thompson Paul A | -- | -- | |
| Burgess Joe F | $132,400 | -- | |
| Nephew David | $81,000 | -- |
Source: Public Records
Mortgage History
| Date | Status | Borrower | Loan Amount |
|---|---|---|---|
| Open | Thompson Paul A | $152,176 | |
| Previous Owner | Us Bank Na | $77,501 |
Source: Public Records
Tax History
| Year | Tax Paid | Tax Assessment Tax Assessment Total Assessment is a certain percentage of the fair market value that is determined by local assessors to be the total taxable value of land and additions on the property. | Land | Improvement |
|---|---|---|---|---|
| 2025 | $2,514 | $95,080 | $24,000 | $71,080 |
| 2024 | $2,514 | $95,080 | $24,000 | $71,080 |
| 2023 | $2,497 | $85,720 | $24,000 | $61,720 |
| 2022 | $2,162 | $74,360 | $24,000 | $50,360 |
| 2021 | $1,943 | $66,360 | $16,000 | $50,360 |
| 2020 | $1,851 | $57,760 | $16,000 | $41,760 |
| 2019 | $1,878 | $57,760 | $16,000 | $41,760 |
| 2018 | $1,836 | $55,760 | $16,000 | $39,760 |
| 2017 | $1,766 | $53,196 | $16,000 | $37,196 |
| 2016 | $1,776 | $53,196 | $16,000 | $37,196 |
| 2015 | $1,573 | $47,196 | $10,000 | $37,196 |
| 2014 | $1,363 | $40,819 | $10,000 | $30,819 |
| 2013 | -- | $40,818 | $10,000 | $30,818 |
Source: Public Records
Map
Nearby Homes
- 70 Tysor Ct
- 304 Bullock Pass
- 320 Bullock Pass
- 328 Bullock Pass
- 368 Bullock Pass
- 382 Bullock Pass
- 398 Bullock Pass
- 351 Bullock Pass
- 365 Bullock Pass
- 414 Bullock Pass
- 379 Bullock Pass
- 395 Bullock Pass
- 411 Bullock Pass
- 425 Bullock Pass
- 441 Bullock Pass
- 581 Rachel View Ct
- 346 Meadow Creek Dr
- 346 Meadowcreek Dr
- 748 Sandstone Trail
- 285 Meadowcreek Dr
Your Personal Tour Guide
Ask me questions while you tour the home.