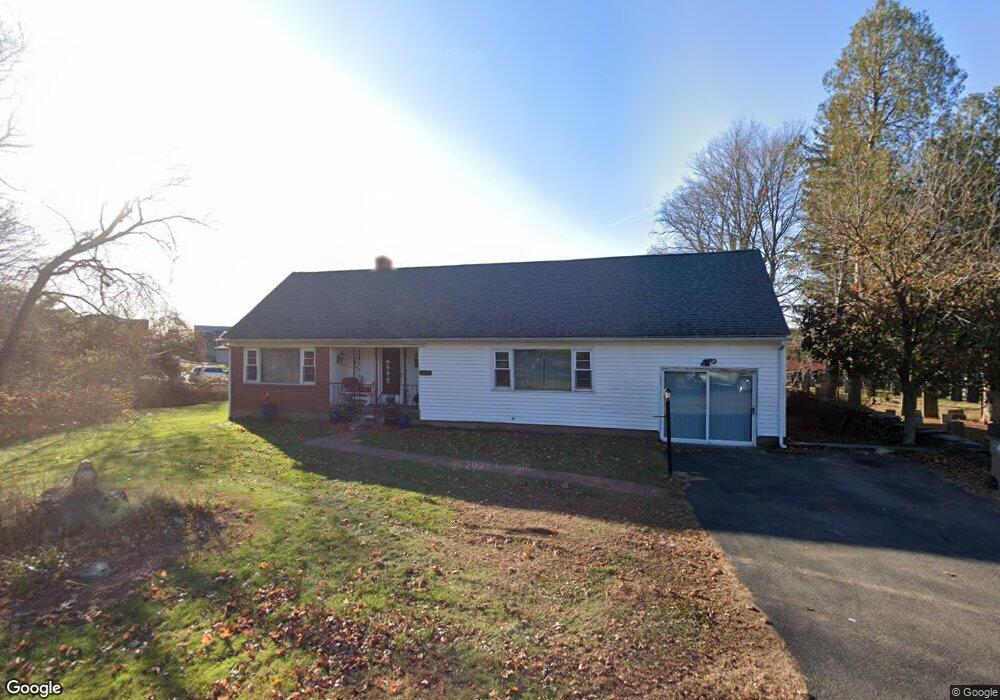
101 Dobson Rd Vernon Rockville, CT 06066
North Vernon NeighborhoodEstimated Value: $343,000 - $376,000
2
Beds
2
Baths
2,026
Sq Ft
$180/Sq Ft
Est. Value
About This Home
This home is located at 101 Dobson Rd, Vernon Rockville, CT 06066 and is currently estimated at $364,431, approximately $179 per square foot. 101 Dobson Rd is a home located in Tolland County with nearby schools including Center Road School, Vernon Center Middle School, and Rockville High School.
Ownership History
Date
Name
Owned For
Owner Type
Purchase Details
Closed on
Jan 3, 2011
Sold by
Daigle Ronald Robert and Daigle Marguerite Mary
Bought by
Daigle Paul Anthony
Current Estimated Value
Home Financials for this Owner
Home Financials are based on the most recent Mortgage that was taken out on this home.
Original Mortgage
$96,500
Interest Rate
4.37%
Purchase Details
Closed on
Sep 12, 2002
Sold by
Clechowski Roberta
Bought by
Daigle Paul and Daigle Ronald
Home Financials for this Owner
Home Financials are based on the most recent Mortgage that was taken out on this home.
Original Mortgage
$105,000
Interest Rate
6.48%
Purchase Details
Closed on
Jan 8, 1999
Sold by
Macdonald Mary
Bought by
Ciechowski Robert
Create a Home Valuation Report for This Property
The Home Valuation Report is an in-depth analysis detailing your home's value as well as a comparison with similar homes in the area
Home Values in the Area
Average Home Value in this Area
Purchase History
| Date | Buyer | Sale Price | Title Company |
|---|---|---|---|
| Daigle Paul Anthony | -- | -- | |
| Daigle Paul | $145,000 | -- | |
| Ciechowski Robert | $119,000 | -- |
Source: Public Records
Mortgage History
| Date | Status | Borrower | Loan Amount |
|---|---|---|---|
| Open | Ciechowski Robert | $122,500 | |
| Closed | Ciechowski Robert | $45,000 | |
| Closed | Ciechowski Robert | $96,500 | |
| Previous Owner | Ciechowski Robert | $105,000 |
Source: Public Records
Tax History Compared to Growth
Tax History
| Year | Tax Paid | Tax Assessment Tax Assessment Total Assessment is a certain percentage of the fair market value that is determined by local assessors to be the total taxable value of land and additions on the property. | Land | Improvement |
|---|---|---|---|---|
| 2025 | $6,280 | $174,010 | $45,290 | $128,720 |
| 2024 | $6,106 | $174,010 | $45,290 | $128,720 |
| 2023 | $5,810 | $174,010 | $45,290 | $128,720 |
| 2022 | $5,810 | $174,010 | $45,290 | $128,720 |
| 2021 | $5,977 | $150,810 | $46,340 | $104,470 |
| 2020 | $5,977 | $150,810 | $46,340 | $104,470 |
| 2019 | $5,977 | $150,810 | $46,340 | $104,470 |
| 2018 | $5,977 | $150,810 | $46,340 | $104,470 |
| 2017 | $5,838 | $150,810 | $46,340 | $104,470 |
| 2016 | $5,644 | $148,410 | $48,090 | $100,320 |
| 2015 | $5,644 | $148,410 | $48,090 | $100,320 |
| 2014 | $5,359 | $148,410 | $48,090 | $100,320 |
Source: Public Records
Map
Nearby Homes
- 33 Sunset Terrace
- 242 Talcottville Rd Unit 105
- 69 Merline Rd
- 325 Kelly Rd
- 325 Kelly Rd Unit L5
- 119 Trout Stream Dr
- 107 Main St
- 25 Oakview Place
- 343 Merline Rd
- 441 Millstream Dr Unit 441
- 6 Elizabeth Ln Unit 3
- 29 Shady Brook Ln Unit 29
- 53 Winding Brook Trail
- 229 Phoenix St
- 38 Winding Brook Trail
- 171 Center Rd
- 5 Allison Rd
- 721 Dart Hill Rd
- 989 Hartford Turnpike
- 413 Lady Bug Ln Unit 413
- 158 Talcottville Rd
- 110 Dobson Rd
- 165 Talcottville Rd
- 11 Pleasant View Dr
- 173 Talcottville Rd
- 151 Talcottville Rd
- 97 Dobson Rd
- 15 Pitkin Rd
- 145 Talcottville Rd
- 17 Pleasant View Dr
- 179 Talcottville Rd Unit B
- 179 Talcottville Rd
- 6 Pleasant View Dr
- 89 Dobson Rd
- 25 Pleasant View Dr
- 100 Dobson Rd Unit 1
- 100 Dobson Rd Unit 15
- 100 Dobson Rd Unit 18
- 100 Dobson Rd Unit 14
- 100 Dobson Rd Unit 8